Price / Percentage change:
| Open | High | Low | Close |
| Latest | 1648.85 | 1661.00 | 1640.60 | 1647.65 |
| Prev day | 1648.45 | 1661.10 | 1640.50 | 1645.90 |
| Last week | 1586.30 | 1624.00 | 1559.15 | 1615.95 |
| Last month | 1650.00 | 1684.75 | 1541.00 | 1645.90 |
| All time | | 2129.00 | 48.20 | |
| 1 Day | 5 Day | 20 Day | 50 Day |
| 0.00% | 4.00% | 1.00% | 2.00% |
Trading range:
| TradingRange | Highest
Close | Lowest
Close | Highest
High | Lowest
Low |
| 5 days | 1647.65 | 1594.40 | 1661.10 | 1578.70 |
| 10 days | 1647.65 | 1547.55 | 1661.10 | 1541.00 |
| 20 days | 1647.65 | 1547.55 | 1661.10 | 1541.00 |
Trend analysis :
| Trend | First Signal | Price | Reversal | P SAR |
| SSS | 19-04-2024 | 1547.55 | 1661.10 | 1663.30 |
| ATR (20d) | Williams R | RSI (5d) | RSI (14d) | Vol | Av Vol (20d) |
| 38.31 | 89 | 74 | 59 | 387000 | 982000
|
Fibonacci price projections:
| 0% | 61.8% | 100% | 161.8% | 261.8% |
| Up | 1541.00 | 1629.84 | 1684.75 | 1773.59 | 1917.34 |
| Dn | 1684.75 | 1595.91 | 1541.00 | 1452.16 | 1308.41 |
Intraday pivot levels:
| Sup 2 | Sup 1 | Pivot | Res 1 | Res 2 |
| 1629.35 | 1638.50 | 1649.75 | 1658.90 | 1670.15 |
Weekly pivot levels:
| Sup 2 | Sup 1 | Pivot | Res 1 | Res 2 |
| 1534.85 | 1575.40 | 1599.70 | 1640.25 | 1664.55 |
Monthly pivot levels:
| Sup 2 | Sup 1 | Pivot | Res 1 | Res 2 |
| 1480.10 | 1562.90 | 1623.85 | 1706.70 | 1767.60 |
Moving averages (simple):
| 5 Day | 20 Day | 50 Day | 200 Day |
| 1628 | 1606 | 1615 |
1308 |
Other levels:
| 52 Week Hi - Lo | Last Mnth Hi - Lo | Swing Hi - Lo | B Band Hi - Lo |
| 1704.25 - 704.10 | 1684.75 - 1541.00 | 1684.75 - 1541.00 | 1650.88 - 1560.47 |
|
Charts...
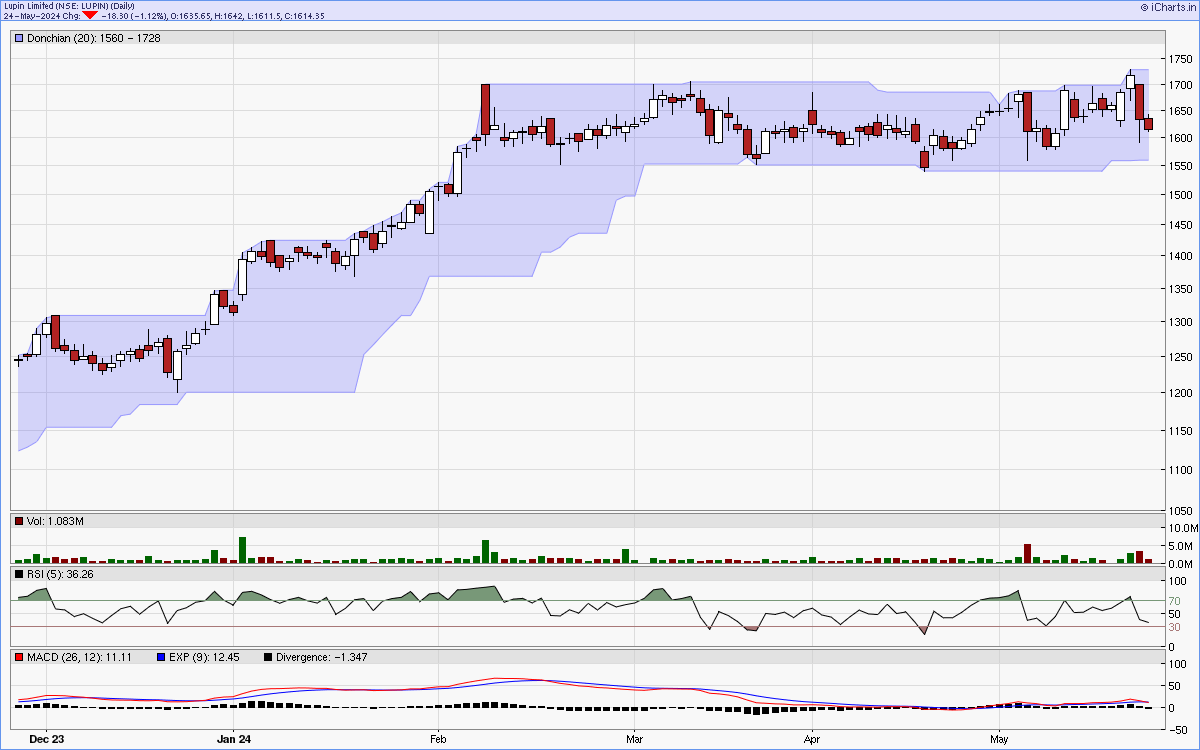
Six months candlestick chart
Charts courtsey: iCharts.in
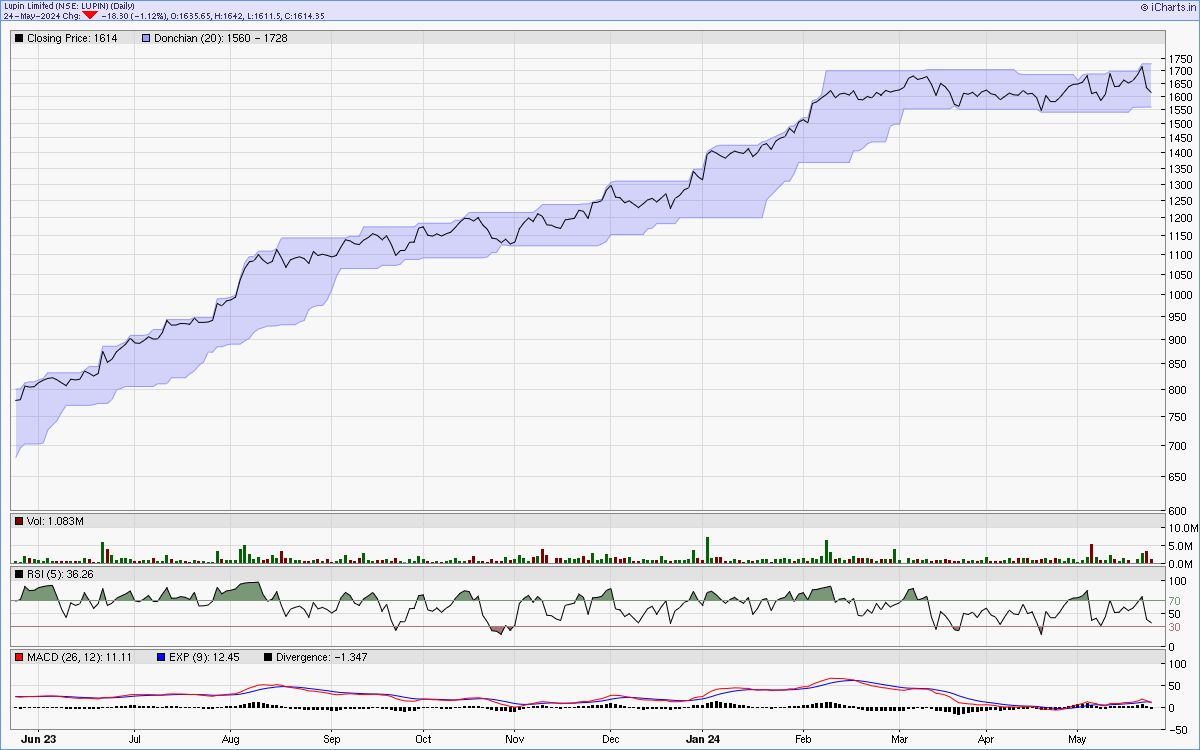
One year line chart
Two years weekly chart
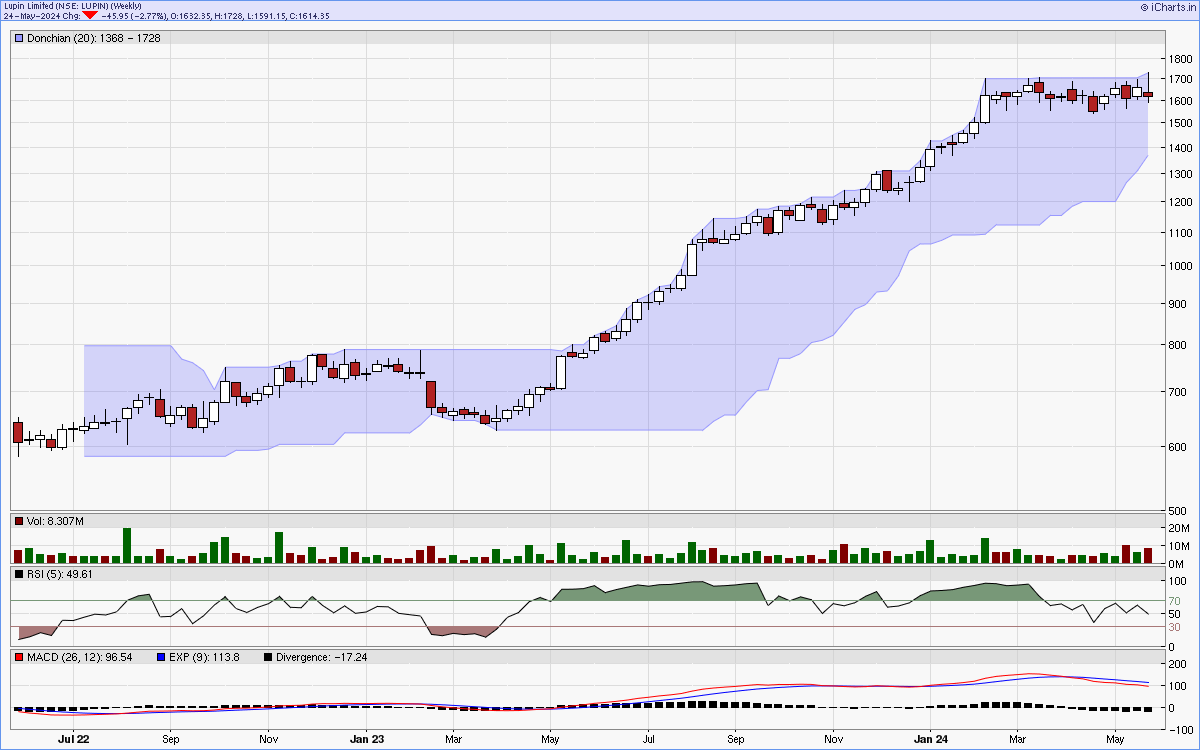
Charts courtsey: iCharts.in