Price / Percentage change:
| Open | High | Low | Close |
| Latest | 632.25 | 632.95 | 597.00 | 606.45 |
| Prev day | 630.00 | 632.00 | 615.95 | 625.85 |
| Last week | 668.00 | 668.40 | 615.95 | 625.85 |
| Last month | 593.90 | 678.80 | 589.80 | 637.25 |
| All time | | 678.80 | 6.10 | |
| 1 Day | 5 Day | 20 Day | 50 Day |
| -3.00% | -8.50% | -0.50% | 2.00% |
Trading range:
| TradingRange | Highest
Close | Lowest
Close | Highest
High | Lowest
Low |
| 5 days | 637.35 | 606.45 | 668.40 | 597.00 |
| 10 days | 670.60 | 606.45 | 678.80 | 597.00 |
| 20 days | 670.60 | 606.45 | 678.80 | 597.00 |
Trend analysis :
| Trend | First Signal | Price | Reversal | P SAR |
| SSS | 06-05-2024 | 606.45 | 678.80 | 675.13 |
| ATR (20d) | Williams R | RSI (5d) | RSI (14d) | Vol | Av Vol (20d) |
| 24.39 | 12 | 21 | 44 | 394000 | 649000
|
Fibonacci price projections:
| 0% | 61.8% | 100% | 161.8% | 261.8% |
| Up | 612.50 | 653.47 | 678.80 | 719.77 | 786.07 |
| Dn | 678.80 | 637.83 | 612.50 | 571.53 | 505.23 |
Intraday pivot levels:
| Sup 2 | Sup 1 | Pivot | Res 1 | Res 2 |
| 576.15 | 591.25 | 612.10 | 627.20 | 648.05 |
Weekly pivot levels:
| Sup 2 | Sup 1 | Pivot | Res 1 | Res 2 |
| 584.25 | 605.00 | 636.70 | 657.45 | 689.15 |
Monthly pivot levels:
| Sup 2 | Sup 1 | Pivot | Res 1 | Res 2 |
| 546.25 | 591.70 | 635.25 | 680.70 | 724.25 |
Moving averages (simple):
| 5 Day | 20 Day | 50 Day | 200 Day |
| 626 | 639 | 602 |
552 |
Other levels:
| 52 Week Hi - Lo | Last Mnth Hi - Lo | Swing Hi - Lo | B Band Hi - Lo |
| 678.80 - 374.15 | 678.80 - 589.80 | 678.80 - 612.50 | 673.56 - 603.63 |
|
Charts...
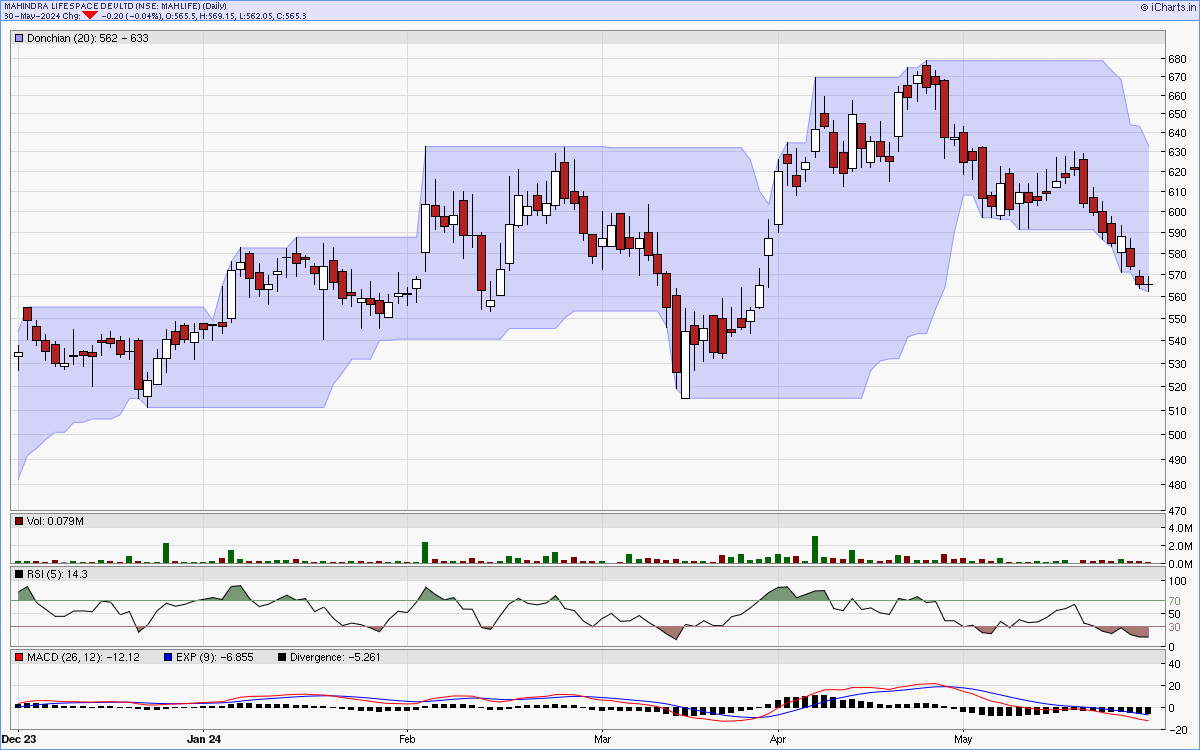
Six months candlestick chart
Charts courtsey: iCharts.in
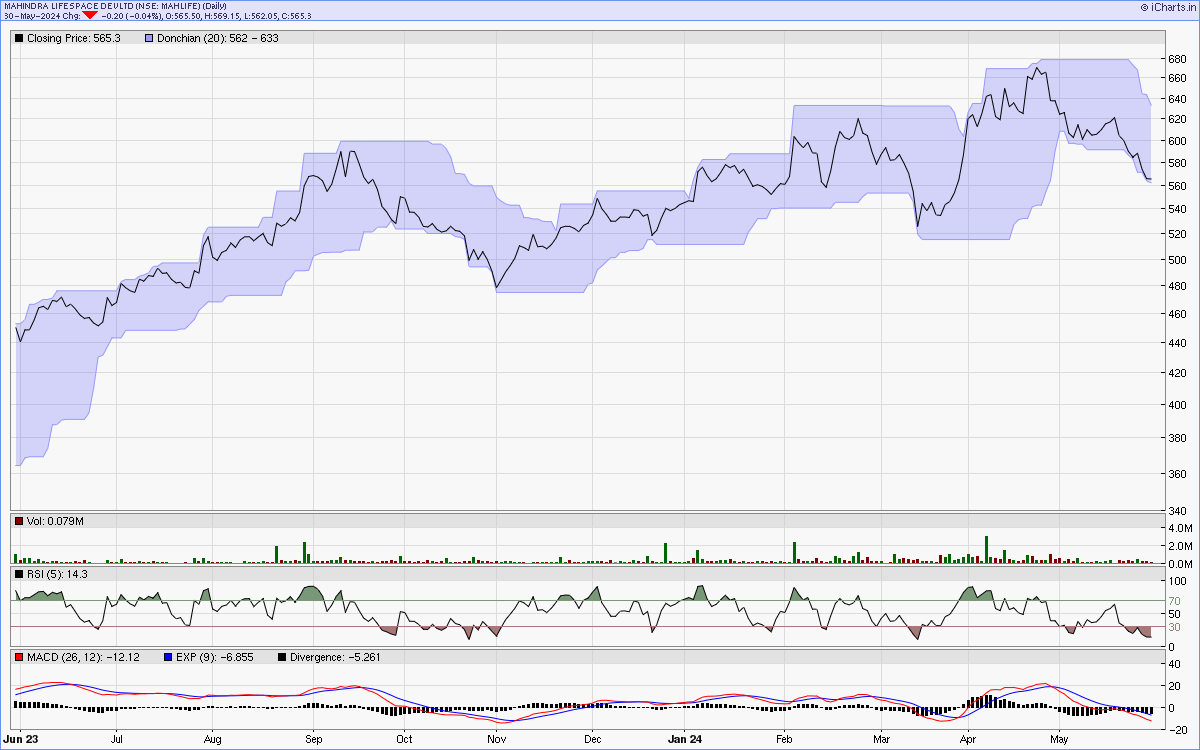
One year line chart
Two years weekly chart
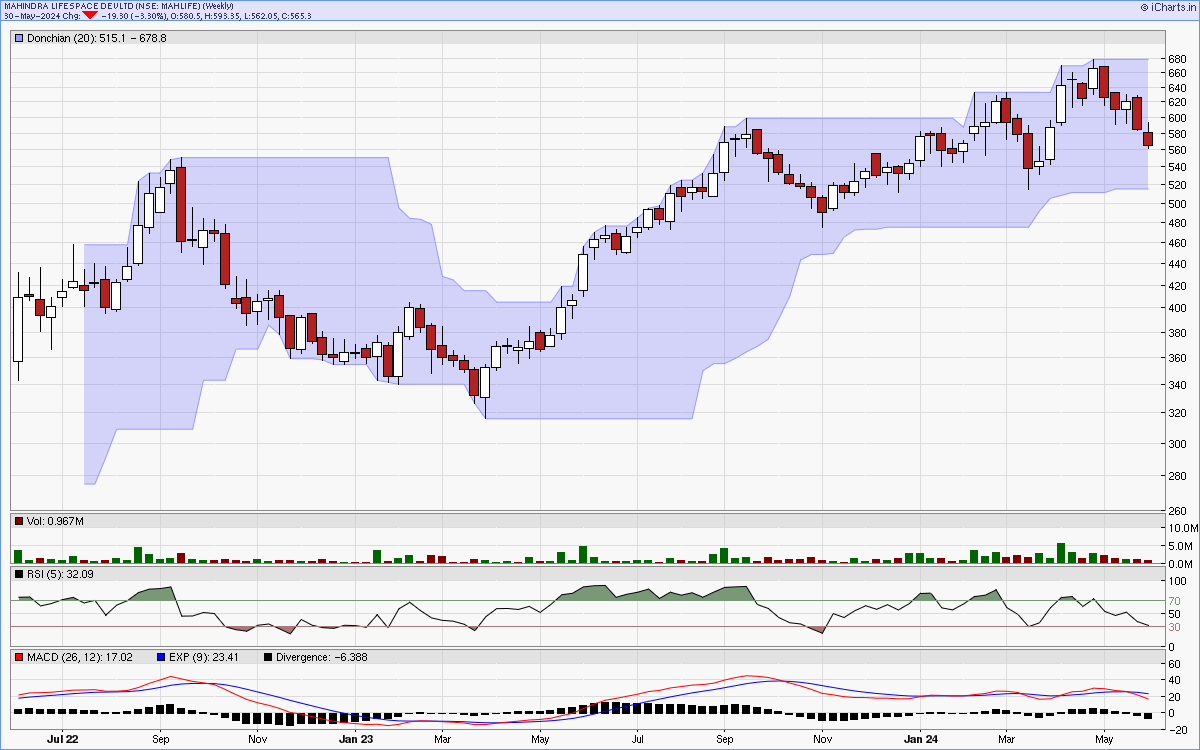
Charts courtsey: iCharts.in