Price / Percentage change:
| Open | High | Low | Close |
| Latest | 1023.85 | 1032.00 | 998.00 | 1001.65 |
| Prev day | 1021.10 | 1038.35 | 1012.00 | 1023.85 |
| Last week | 1032.00 | 1092.00 | 995.15 | 998.85 |
| Last month | 1007.45 | 1092.00 | 969.05 | 1010.90 |
| All time | | 1148.05 | 276.35 | |
| 1 Day | 5 Day | 20 Day | 50 Day |
| -2.00% | -1.50% | -1.00% | 5.50% |
Trading range:
| TradingRange | Highest
Close | Lowest
Close | Highest
High | Lowest
Low |
| 5 days | 1023.85 | 975.85 | 1038.35 | 969.05 |
| 10 days | 1060.30 | 975.85 | 1092.00 | 969.05 |
| 20 days | 1060.30 | 975.85 | 1092.00 | 969.05 |
Trend analysis :
| Trend | First Signal | Price | Reversal | P SAR |
| SSS | 29-04-2024 | 975.85 | 1092.00 | 1071.80 |
| ATR (20d) | Williams R | RSI (5d) | RSI (14d) | Vol | Av Vol (20d) |
| 33.95 | 27 | 43 | 49 | 1005000 | 1190000
|
Fibonacci price projections:
| 0% | 61.8% | 100% | 161.8% | 261.8% |
| Up | 969.05 | 1045.03 | 1092.00 | 1167.98 | 1290.93 |
| Dn | 1092.00 | 1016.02 | 969.05 | 893.07 | 770.12 |
Intraday pivot levels:
| Sup 2 | Sup 1 | Pivot | Res 1 | Res 2 |
| 976.55 | 989.10 | 1010.55 | 1023.10 | 1044.55 |
Weekly pivot levels:
| Sup 2 | Sup 1 | Pivot | Res 1 | Res 2 |
| 931.80 | 965.30 | 1028.65 | 1062.15 | 1125.50 |
Monthly pivot levels:
| Sup 2 | Sup 1 | Pivot | Res 1 | Res 2 |
| 901.00 | 955.90 | 1023.95 | 1078.85 | 1146.90 |
Moving averages (simple):
| 5 Day | 20 Day | 50 Day | 200 Day |
| 1002 | 1021 | 990 |
933 |
Other levels:
| 52 Week Hi - Lo | Last Mnth Hi - Lo | Swing Hi - Lo | B Band Hi - Lo |
| 1092.00 - 635.75 | 1092.00 - 969.05 | 1092.00 - 969.05 | 1061.53 - 980.93 |
|
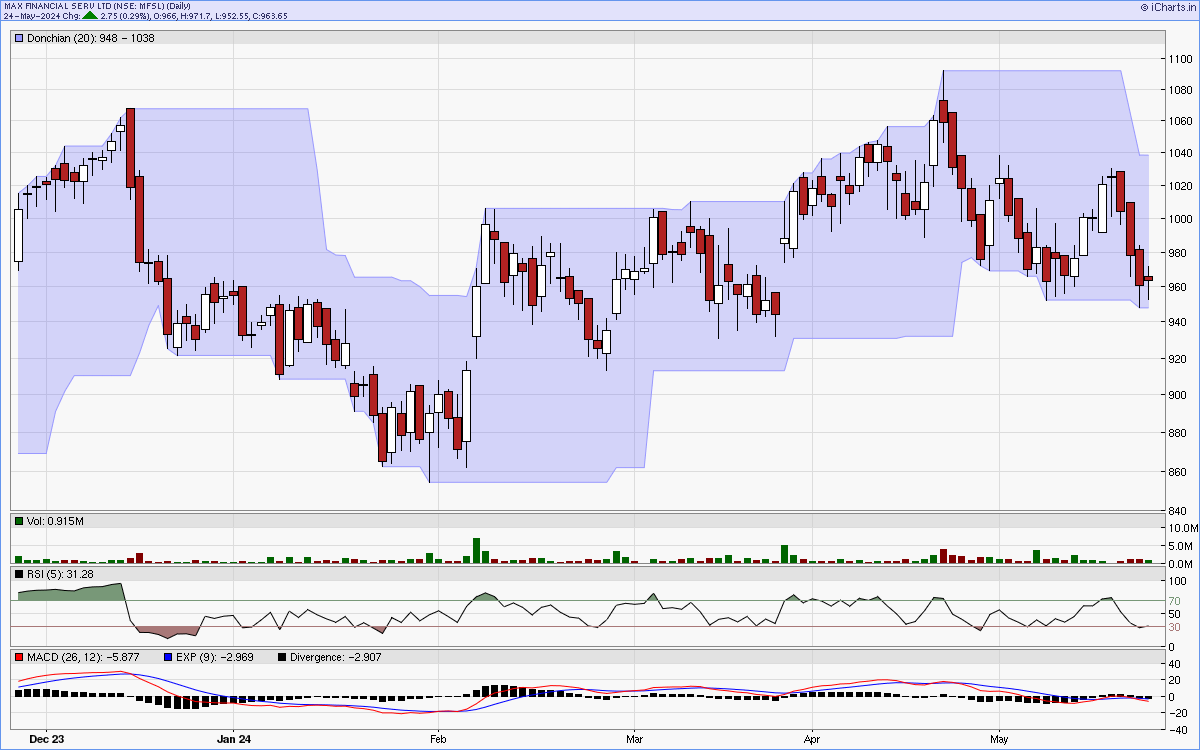
Charts...
Six months candlestick chart
Charts courtsey: iCharts.in
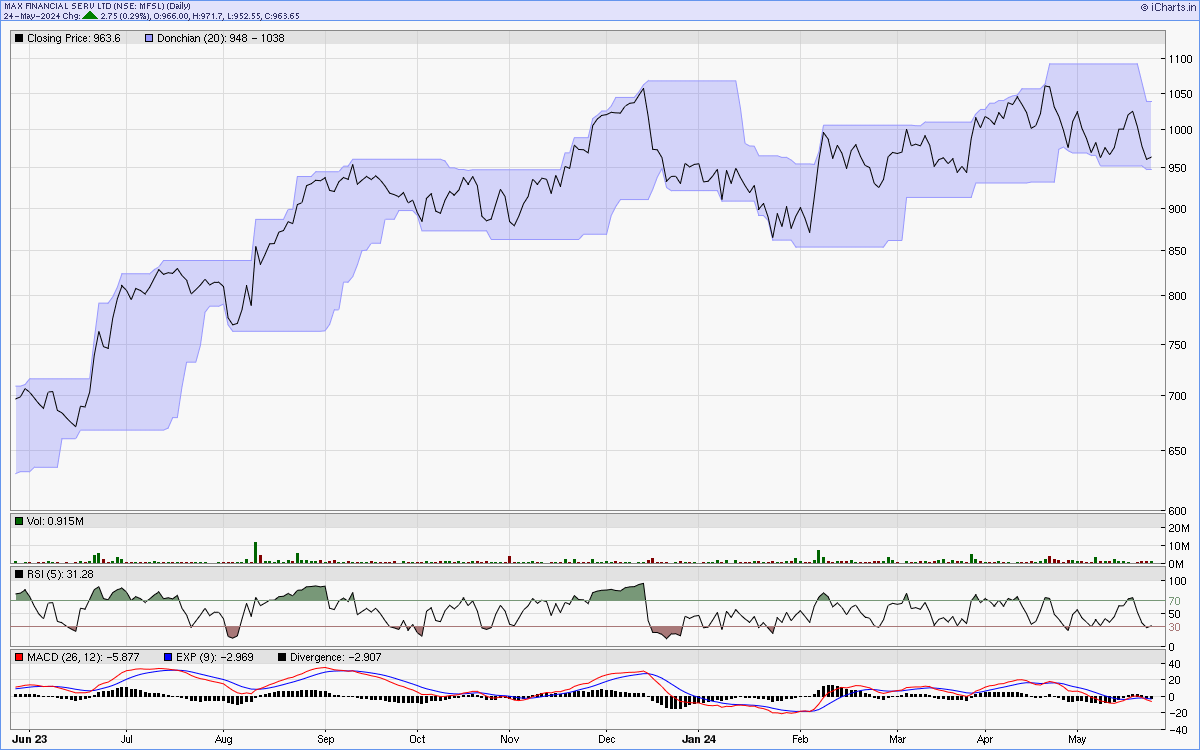
One year line chart
Two years weekly chart
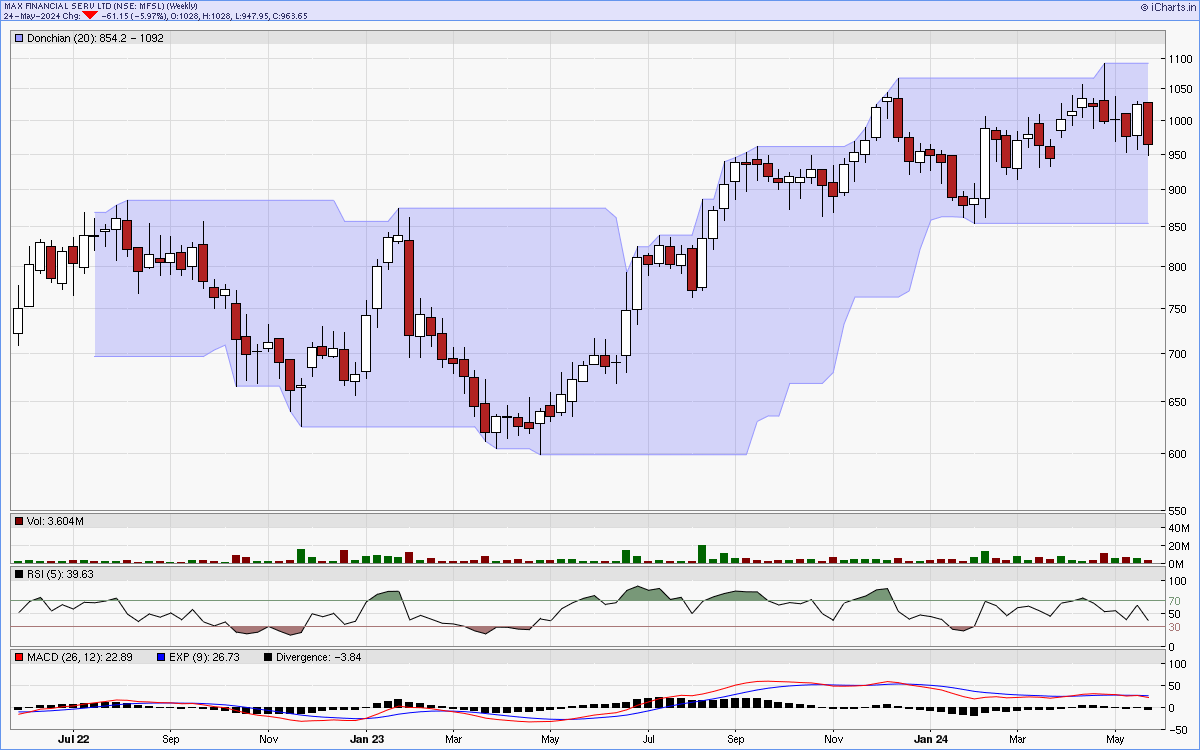
Charts courtsey: iCharts.in