Price / Percentage change:
| Open | High | Low | Close |
| Latest | 2393.55 | 2488.00 | 2385.05 | 2442.55 |
| Prev day | 2496.05 | 2509.15 | 2365.35 | 2376.90 |
| Last week | 2295.00 | 2678.10 | 2269.00 | 2597.30 |
| Last month | 1681.10 | 2678.10 | 1681.10 | 2376.90 |
| All time | | 2678.10 | 43.60 | |
| 1 Day | 5 Day | 20 Day | 50 Day |
| 2.50% | 3.50% | 39.00% | 35.50% |
Trading range:
| TradingRange | Highest
Close | Lowest
Close | Highest
High | Lowest
Low |
| 5 days | 2597.30 | 2376.90 | 2678.10 | 2346.95 |
| 10 days | 2597.30 | 2085.65 | 2678.10 | 2025.35 |
| 20 days | 2597.30 | 1789.15 | 2678.10 | 1725.00 |
Trend analysis :
| Trend | First Signal | Price | Reversal | P SAR |
| BBB | 02-04-2024 | 1789.15 | 1725.00 | 2270.47 |
| ATR (20d) | Williams R | RSI (5d) | RSI (14d) | Vol | Av Vol (20d) |
| 109.90 | 67 | 60 | 68 | 335000 | 412000
|
Fibonacci price projections:
| 0% | 61.8% | 100% | 161.8% | 261.8% |
| Up | 1381.45 | 2182.78 | 2678.10 | 3479.43 | 4776.08 |
| Dn | 2678.10 | 1876.77 | 1381.45 | 580.12 | -716.53 |
Intraday pivot levels:
| Sup 2 | Sup 1 | Pivot | Res 1 | Res 2 |
| 2335.55 | 2389.00 | 2438.50 | 2491.95 | 2541.45 |
Weekly pivot levels:
| Sup 2 | Sup 1 | Pivot | Res 1 | Res 2 |
| 2105.70 | 2351.50 | 2514.80 | 2760.60 | 2923.90 |
Monthly pivot levels:
| Sup 2 | Sup 1 | Pivot | Res 1 | Res 2 |
| 1248.35 | 1812.60 | 2245.35 | 2809.60 | 3242.35 |
Moving averages (simple):
| 5 Day | 20 Day | 50 Day | 200 Day |
| 2475 | 2154 | 1843 |
1292 |
Other levels:
| 52 Week Hi - Lo | Last Mnth Hi - Lo | Swing Hi - Lo | B Band Hi - Lo |
| 2678.10 - 582.70 | 2678.10 - 1681.10 | 2678.10 - 1381.45 | 2650.01 - 1657.79 |
|
Charts...
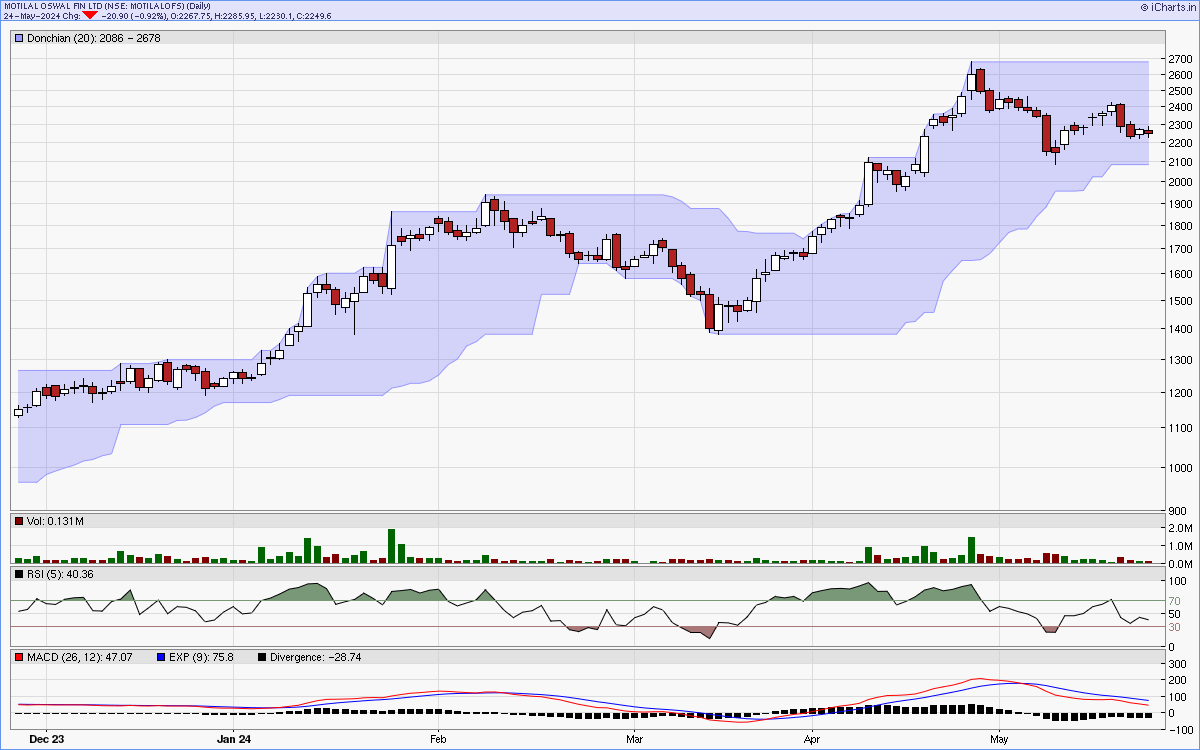
Six months candlestick chart
Charts courtsey: iCharts.in
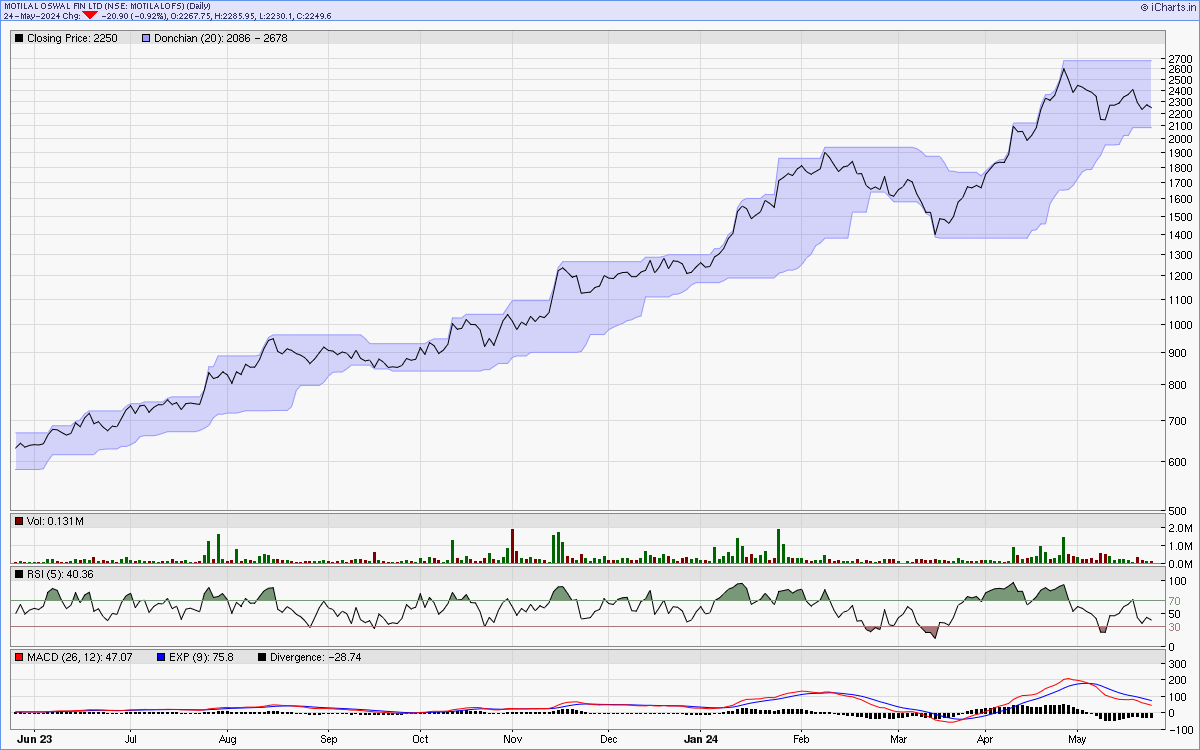
One year line chart
Two years weekly chart
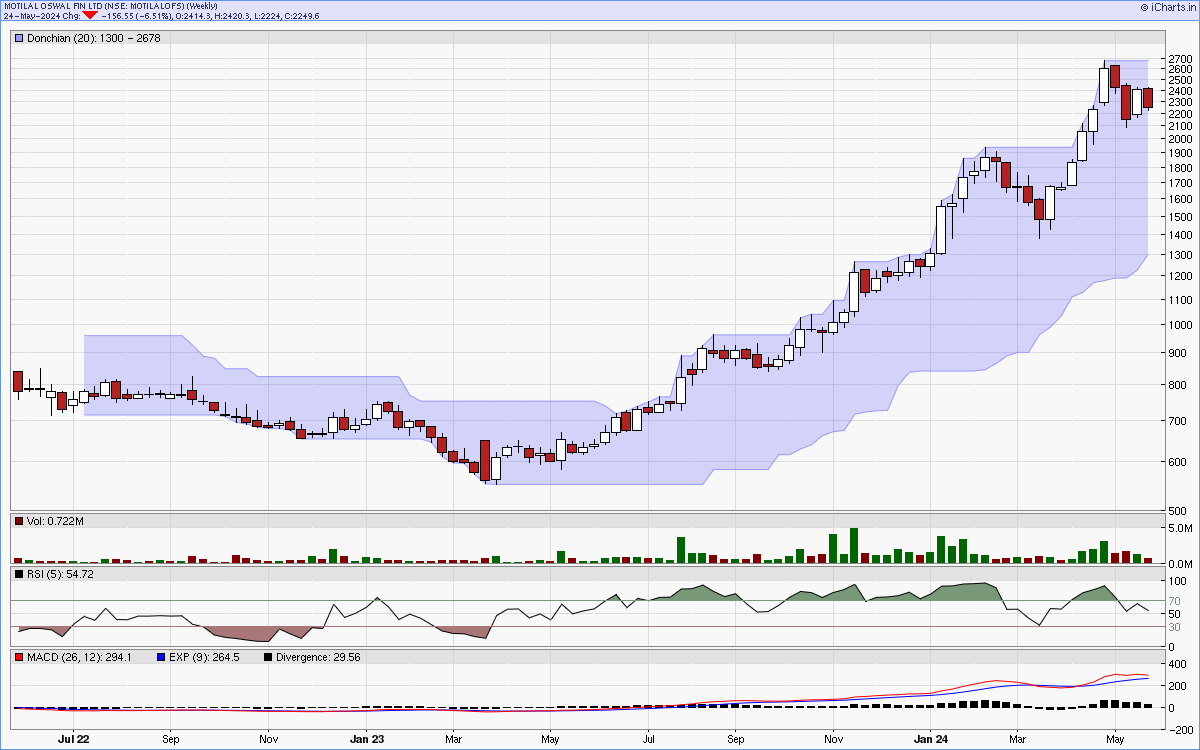
Charts courtsey: iCharts.in