Price / Percentage change:
| Open | High | Low | Close |
| Latest | 643.00 | 643.00 | 618.50 | 623.60 |
| Prev day | 638.00 | 644.45 | 633.05 | 641.25 |
| Last week | 638.95 | 658.00 | 627.65 | 630.80 |
| Last month | 672.50 | 713.00 | 621.05 | 641.25 |
| All time | | 1678.00 | 475.05 | |
| 1 Day | 5 Day | 20 Day | 50 Day |
| -2.50% | -4.00% | -10.00% | -26.00% |
Trading range:
| TradingRange | Highest
Close | Lowest
Close | Highest
High | Lowest
Low |
| 5 days | 641.25 | 623.60 | 651.00 | 618.50 |
| 10 days | 650.85 | 623.60 | 658.00 | 618.50 |
| 20 days | 706.95 | 623.60 | 713.00 | 618.50 |
Trend analysis :
| Trend | First Signal | Price | Reversal | P SAR |
| SSS | 05-02-2024 | 836.45 | 713.00 | 651.06 |
| ATR (20d) | Williams R | RSI (5d) | RSI (14d) | Vol | Av Vol (20d) |
| 22.37 | 8 | 32 | 36 | 492000 | 365000
|
Fibonacci price projections:
| 0% | 61.8% | 100% | 161.8% | 261.8% |
| Up | 621.05 | 659.09 | 682.60 | 720.64 | 782.19 |
| Dn | 682.60 | 644.56 | 621.05 | 583.01 | 521.46 |
Intraday pivot levels:
| Sup 2 | Sup 1 | Pivot | Res 1 | Res 2 |
| 603.85 | 613.70 | 628.35 | 638.20 | 652.85 |
Weekly pivot levels:
| Sup 2 | Sup 1 | Pivot | Res 1 | Res 2 |
| 608.40 | 619.55 | 638.80 | 649.90 | 669.15 |
Monthly pivot levels:
| Sup 2 | Sup 1 | Pivot | Res 1 | Res 2 |
| 566.40 | 603.80 | 658.40 | 695.75 | 750.35 |
Moving averages (simple):
| 5 Day | 20 Day | 50 Day | 200 Day |
| 634 | 651 | 698 |
779 |
Other levels:
| 52 Week Hi - Lo | Last Mnth Hi - Lo | Swing Hi - Lo | B Band Hi - Lo |
| 989.40 - 558.85 | 713.00 - 621.05 | 682.60 - 621.05 | 695.08 - 606.87 |
|
Charts...
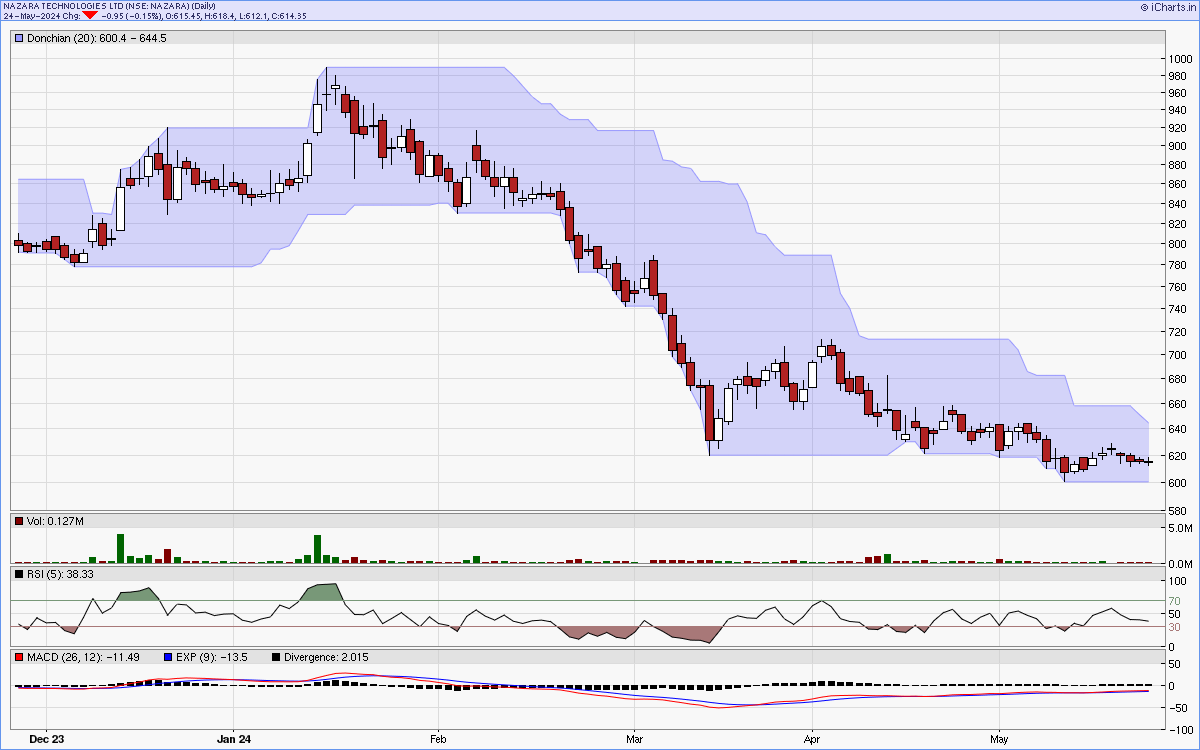
Six months candlestick chart
Charts courtsey: iCharts.in
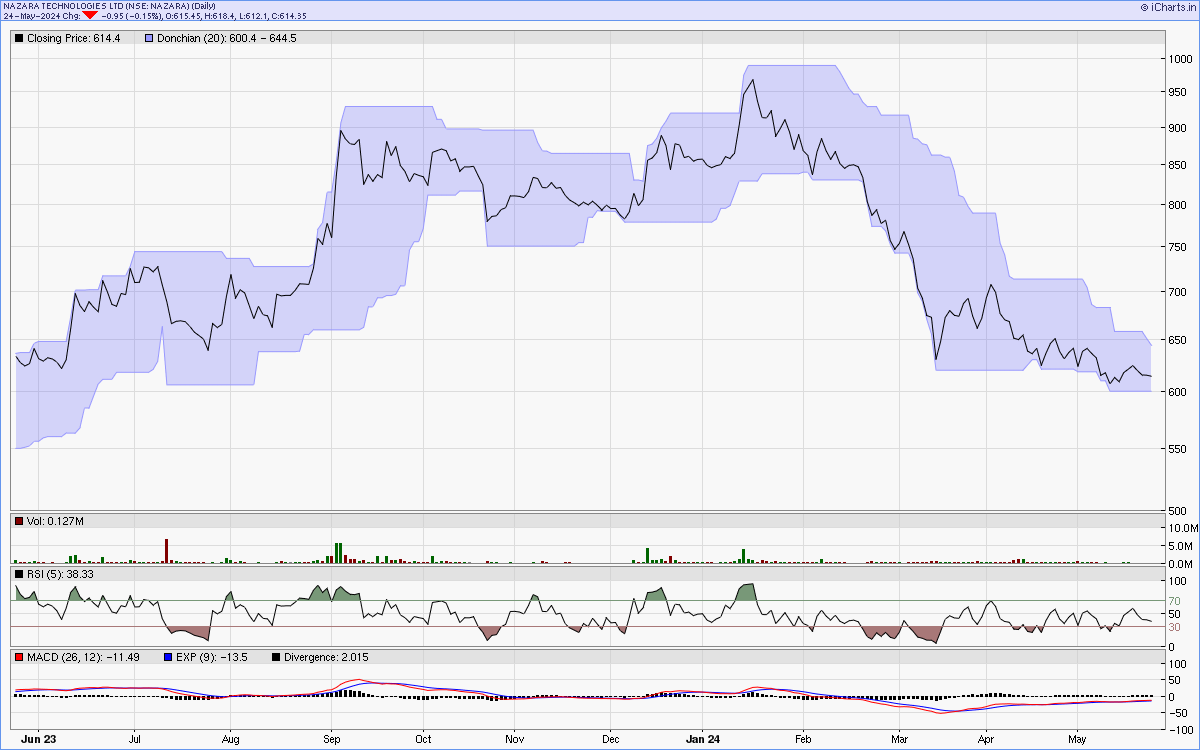
One year line chart
Two years weekly chart
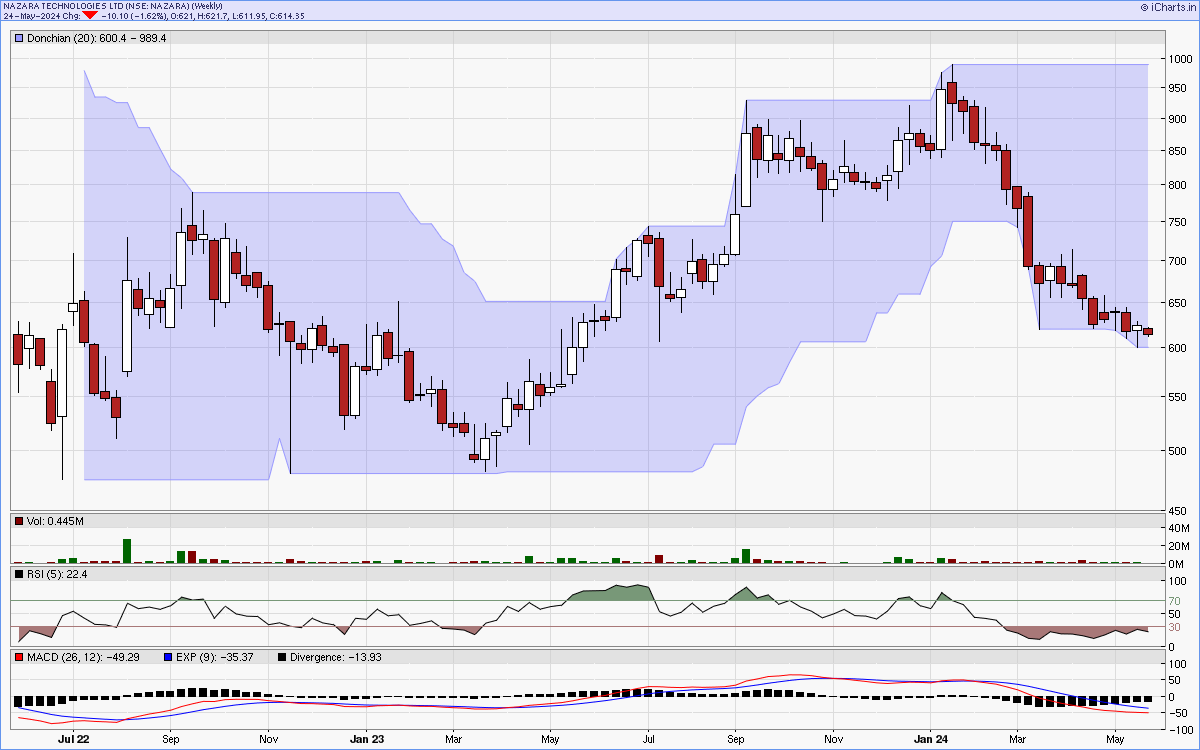
Charts courtsey: iCharts.in