Price / Percentage change:
| Open | High | Low | Close |
| Latest | 768.00 | 768.05 | 750.00 | 754.15 |
| Prev day | 764.00 | 769.25 | 756.10 | 761.20 |
| Last week | 749.05 | 848.65 | 744.00 | 762.20 |
| Last month | 712.00 | 848.65 | 695.00 | 756.25 |
| All time | | 1090.00 | 21.15 | |
| 1 Day | 5 Day | 20 Day | 50 Day |
| -0.50% | -0.50% | 2.00% | -1.50% |
Trading range:
| TradingRange | Highest
Close | Lowest
Close | Highest
High | Lowest
Low |
| 5 days | 762.20 | 754.15 | 783.45 | 750.00 |
| 10 days | 808.55 | 742.30 | 848.65 | 734.50 |
| 20 days | 808.55 | 723.20 | 848.65 | 708.60 |
Trend analysis :
| Trend | First Signal | Price | Reversal | P SAR |
| BBB | 22-04-2024 | 793.65 | 708.60 | 746.62 |
| ATR (20d) | Williams R | RSI (5d) | RSI (14d) | Vol | Av Vol (20d) |
| 27.75 | 33 | 42 | 50 | 55000 | 172000
|
Fibonacci price projections:
| 0% | 61.8% | 100% | 161.8% | 261.8% |
| Up | 708.60 | 795.15 | 848.65 | 935.20 | 1075.25 |
| Dn | 848.65 | 762.10 | 708.60 | 622.05 | 482.00 |
Intraday pivot levels:
| Sup 2 | Sup 1 | Pivot | Res 1 | Res 2 |
| 739.35 | 746.75 | 757.40 | 764.80 | 775.40 |
Weekly pivot levels:
| Sup 2 | Sup 1 | Pivot | Res 1 | Res 2 |
| 680.30 | 721.25 | 784.95 | 825.90 | 889.60 |
Monthly pivot levels:
| Sup 2 | Sup 1 | Pivot | Res 1 | Res 2 |
| 612.95 | 684.55 | 766.60 | 838.20 | 920.25 |
Moving averages (simple):
| 5 Day | 20 Day | 50 Day | 200 Day |
| 759 | 760 | 750 |
776 |
Other levels:
| 52 Week Hi - Lo | Last Mnth Hi - Lo | Swing Hi - Lo | B Band Hi - Lo |
| 893.80 - 580.80 | 848.65 - 695.00 | 848.65 - 708.60 | 795.08 - 724.78 |
|
Charts...
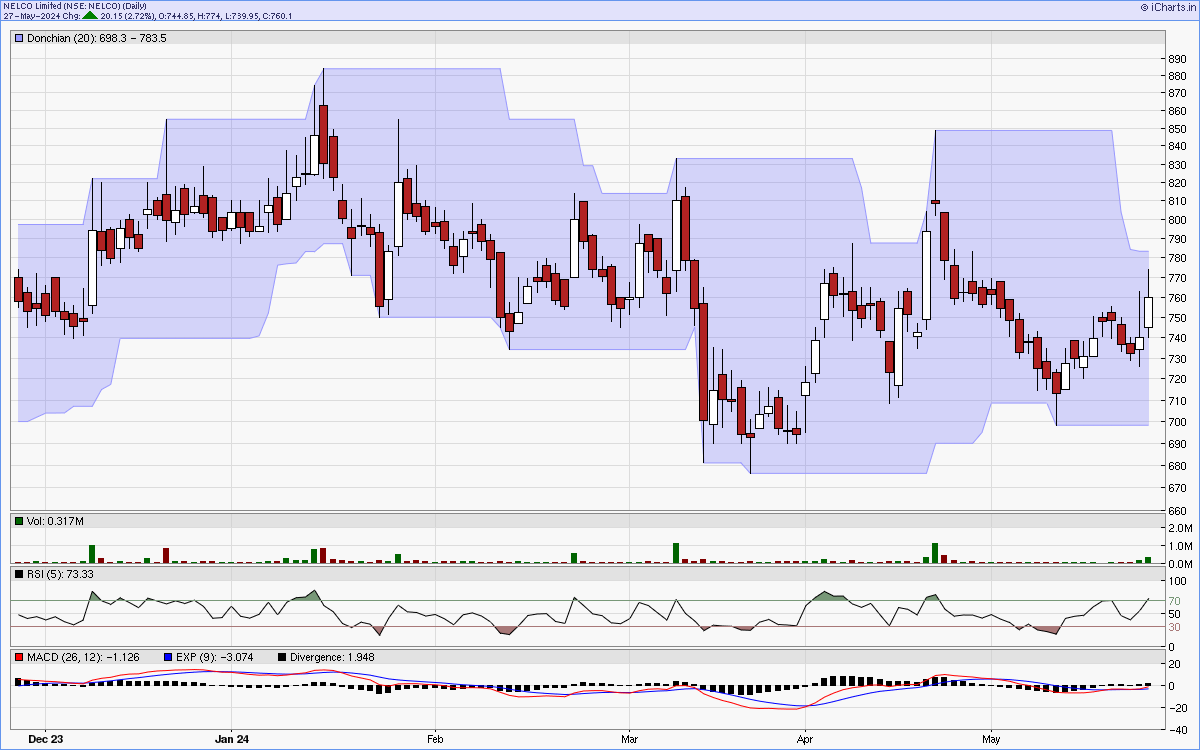
Six months candlestick chart
Charts courtsey: iCharts.in
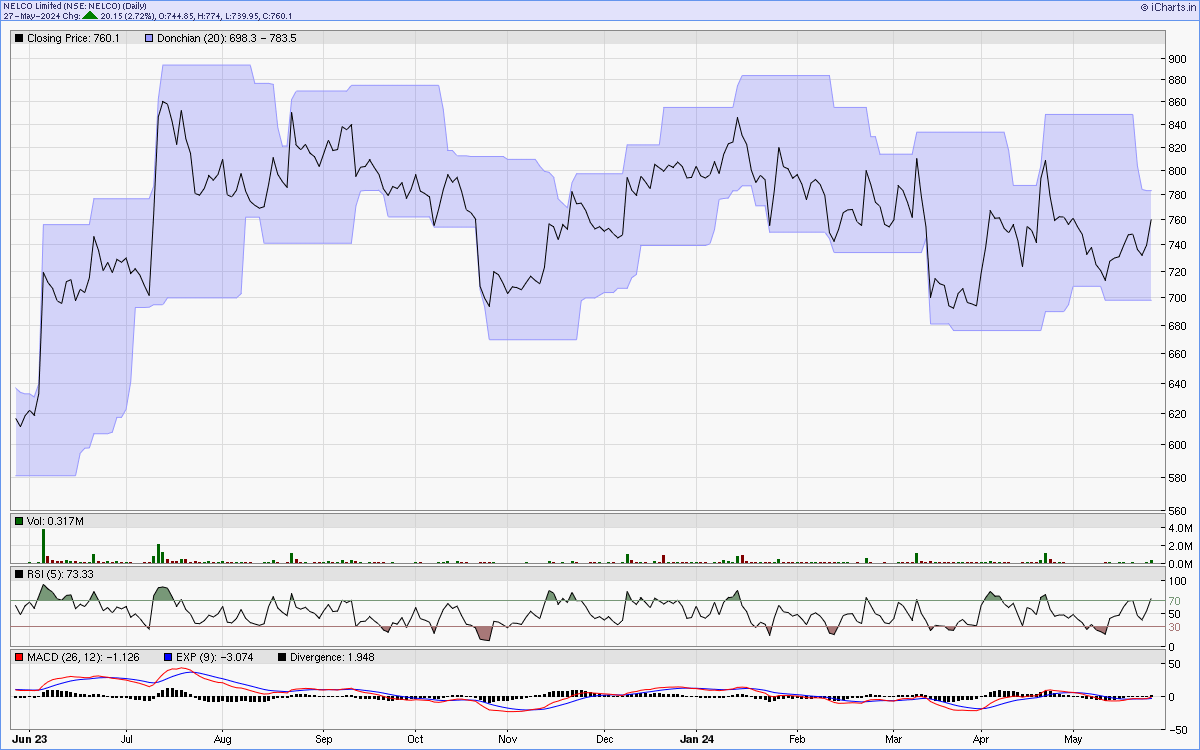
One year line chart
Two years weekly chart
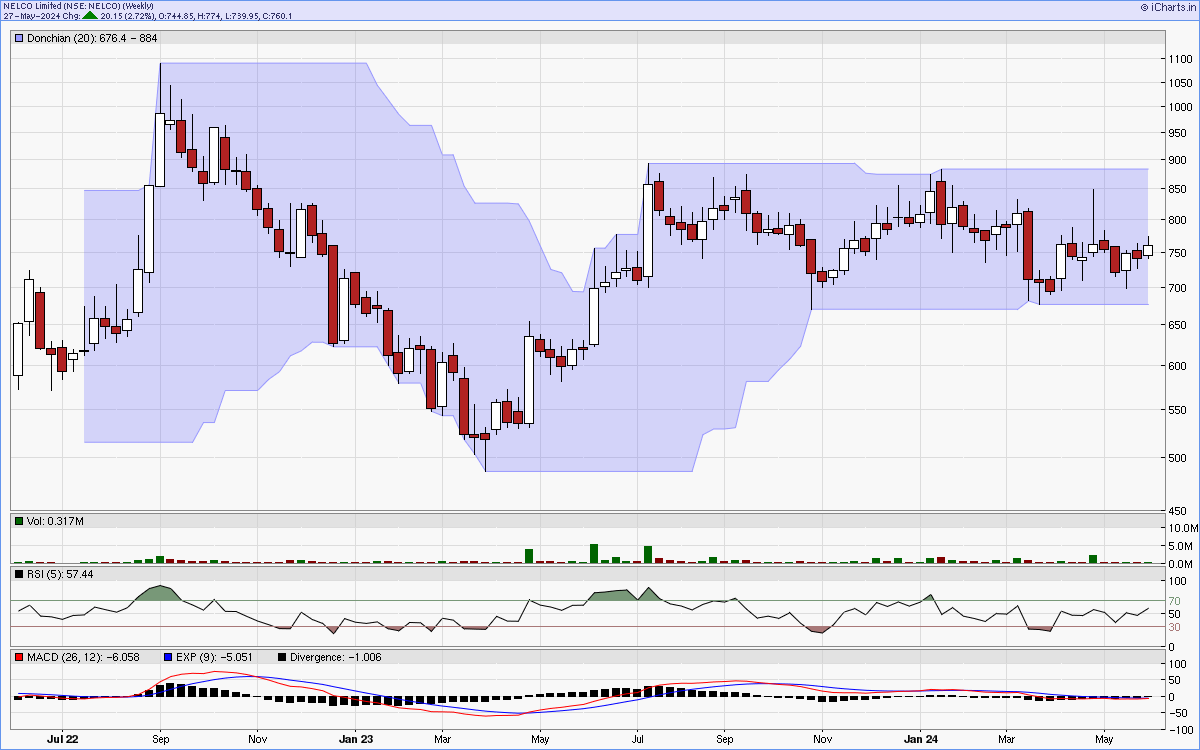
Charts courtsey: iCharts.in