Price / Percentage change:
| Open | High | Low | Close |
| Latest | 271.70 | 273.20 | 258.00 | 269.40 |
| Prev day | 258.50 | 269.90 | 258.15 | 268.95 |
| Last week | 260.75 | 269.90 | 252.20 | 268.95 |
| Last month | 204.80 | 261.50 | 203.30 | 254.40 |
| All time | | 273.20 | 98.60 | |
| 1 Day | 5 Day | 20 Day | 50 Day |
| 0.00% | 4.00% | 23.50% | 10.00% |
Trading range:
| TradingRange | Highest
Close | Lowest
Close | Highest
High | Lowest
Low |
| 5 days | 269.40 | 254.40 | 273.20 | 252.20 |
| 10 days | 269.40 | 234.65 | 273.20 | 233.95 |
| 20 days | 269.40 | 216.80 | 273.20 | 212.95 |
Trend analysis :
| Trend | First Signal | Price | Reversal | P SAR |
| BBB | 10-04-2024 | 241.10 | 212.95 | 252.20 |
| ATR (20d) | Williams R | RSI (5d) | RSI (14d) | Vol | Av Vol (20d) |
| 8.98 | 91 | 87 | 75 | 26526000 | 18511000
|
Fibonacci price projections:
| 0% | 61.8% | 100% | 161.8% | 261.8% |
| Up | 229.35 | 240.16 | 246.85 | 257.66 | 275.16 |
| Dn | 246.85 | 236.03 | 229.35 | 218.53 | 201.03 |
Intraday pivot levels:
| Sup 2 | Sup 1 | Pivot | Res 1 | Res 2 |
| 251.65 | 260.50 | 266.85 | 275.70 | 282.05 |
Weekly pivot levels:
| Sup 2 | Sup 1 | Pivot | Res 1 | Res 2 |
| 245.95 | 257.40 | 263.65 | 275.05 | 281.30 |
Monthly pivot levels:
| Sup 2 | Sup 1 | Pivot | Res 1 | Res 2 |
| 181.50 | 217.90 | 239.70 | 276.05 | 297.90 |
Moving averages (simple):
| 5 Day | 20 Day | 50 Day | 200 Day |
| 261 | 243 | 230 |
182 |
Other levels:
| 52 Week Hi - Lo | Last Mnth Hi - Lo | Swing Hi - Lo | B Band Hi - Lo |
| 273.20 - 103.75 | 261.50 - 203.30 | 246.85 - 229.35 | 272.32 - 213.27 |
|
Charts...
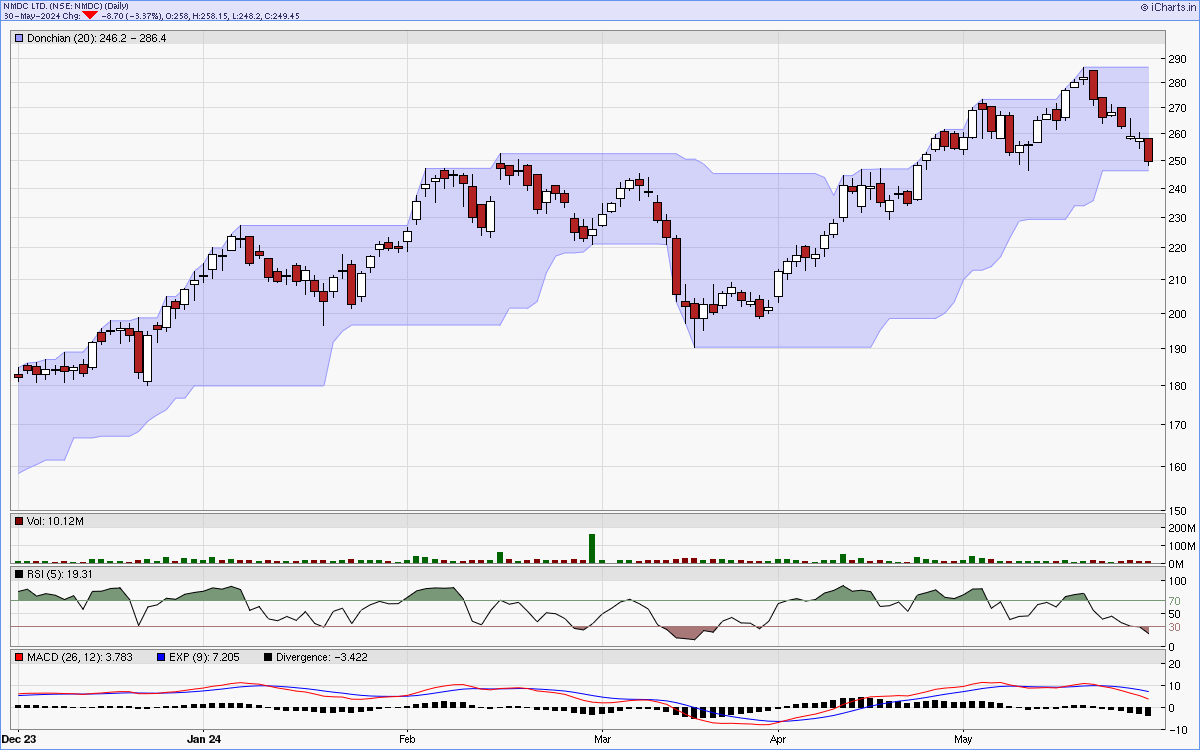
Six months candlestick chart
Charts courtsey: iCharts.in
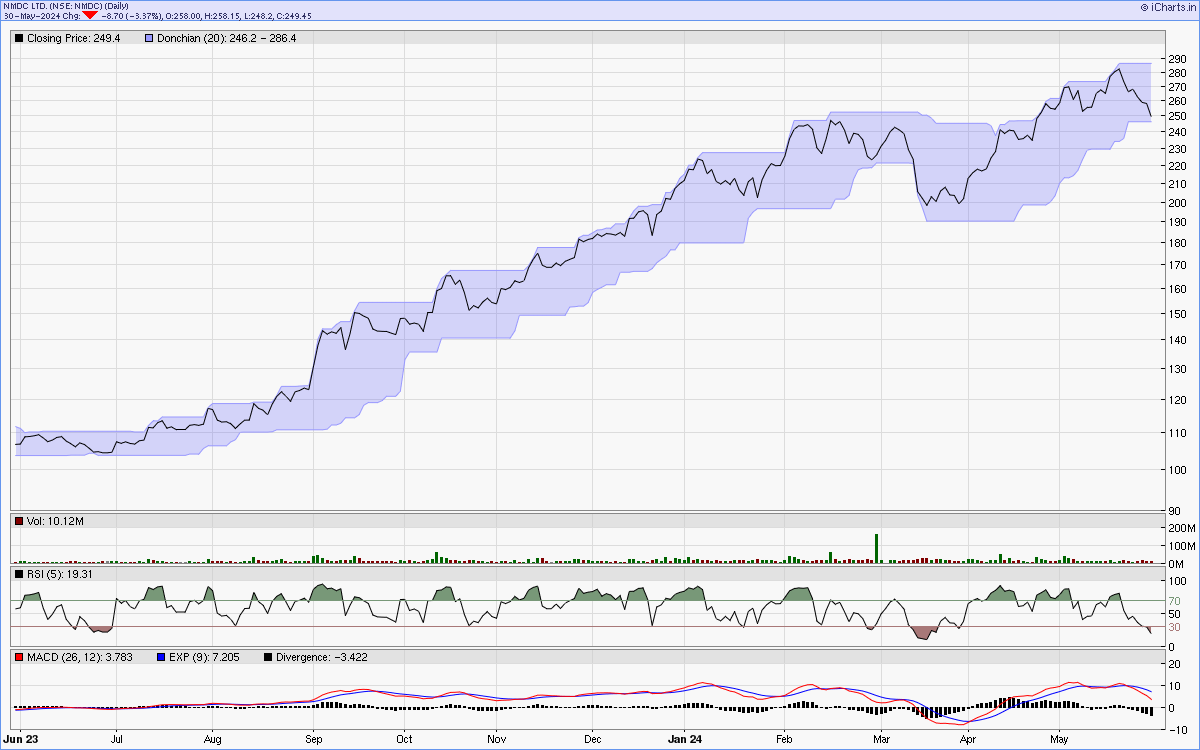
One year line chart
Two years weekly chart
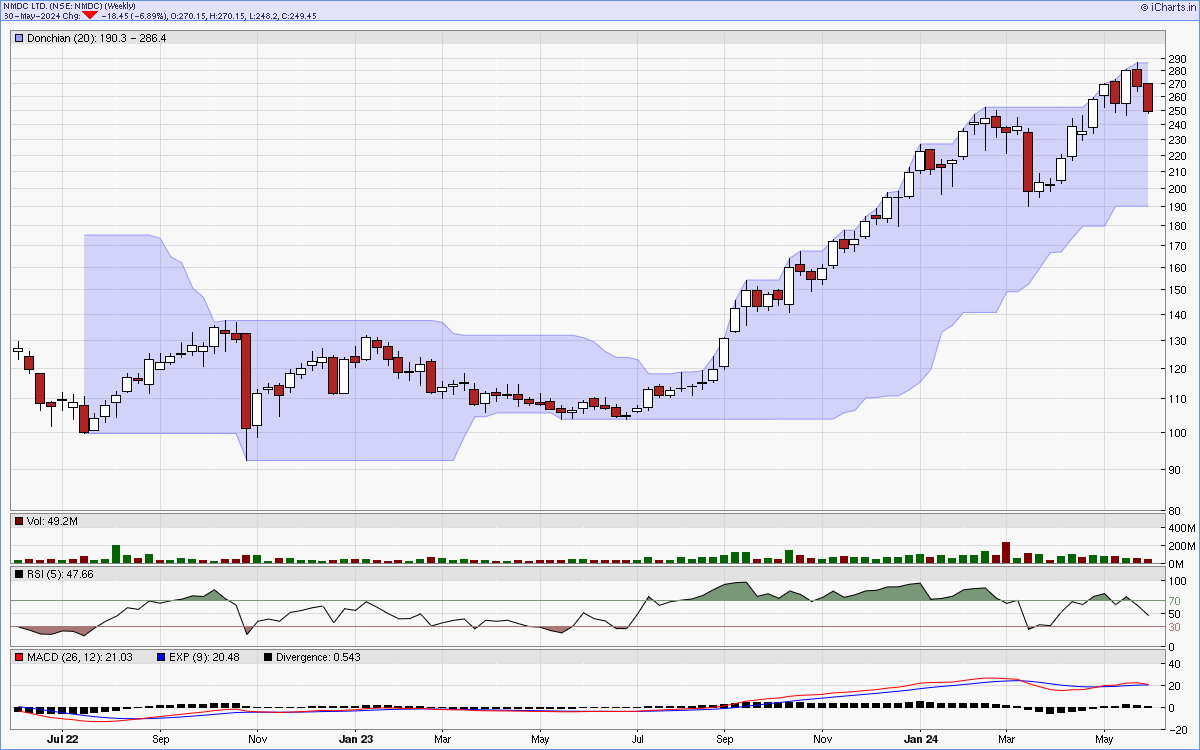
Charts courtsey: iCharts.in