Price / Percentage change:
| Open | High | Low | Close |
| Latest | 336.90 | 337.65 | 329.05 | 333.75 |
| Prev day | 341.00 | 341.00 | 333.65 | 335.05 |
| Last week | 335.00 | 354.40 | 325.00 | 341.70 |
| Last month | 307.35 | 354.40 | 303.00 | 338.60 |
| All time | | 577.90 | 260.25 | |
| 1 Day | 5 Day | 20 Day | 50 Day |
| 0.00% | -2.50% | 3.00% | -0.50% |
Trading range:
| TradingRange | Highest
Close | Lowest
Close | Highest
High | Lowest
Low |
| 5 days | 341.70 | 333.75 | 351.15 | 329.05 |
| 10 days | 347.80 | 326.60 | 354.40 | 307.25 |
| 20 days | 347.80 | 306.05 | 354.40 | 303.00 |
Trend analysis :
| Trend | First Signal | Price | Reversal | P SAR |
| BBB | 22-04-2024 | 333.05 | 303.00 | 325.96 |
| ATR (20d) | Williams R | RSI (5d) | RSI (14d) | Vol | Av Vol (20d) |
| 10.93 | 60 | 44 | 55 | 615000 | 656000
|
Fibonacci price projections:
| 0% | 61.8% | 100% | 161.8% | 261.8% |
| Up | 303.00 | 334.77 | 354.40 | 386.17 | 437.57 |
| Dn | 354.40 | 322.63 | 303.00 | 271.23 | 219.83 |
Intraday pivot levels:
| Sup 2 | Sup 1 | Pivot | Res 1 | Res 2 |
| 324.85 | 329.25 | 333.45 | 337.80 | 342.00 |
Weekly pivot levels:
| Sup 2 | Sup 1 | Pivot | Res 1 | Res 2 |
| 310.95 | 326.30 | 340.35 | 355.70 | 369.75 |
Monthly pivot levels:
| Sup 2 | Sup 1 | Pivot | Res 1 | Res 2 |
| 280.60 | 309.60 | 332.00 | 361.00 | 383.40 |
Moving averages (simple):
| 5 Day | 20 Day | 50 Day | 200 Day |
| 338 | 327 | 323 |
349 |
Other levels:
| 52 Week Hi - Lo | Last Mnth Hi - Lo | Swing Hi - Lo | B Band Hi - Lo |
| 398.00 - 291.30 | 354.40 - 303.00 | 354.40 - 303.00 | 352.62 - 301.47 |
|
Charts...
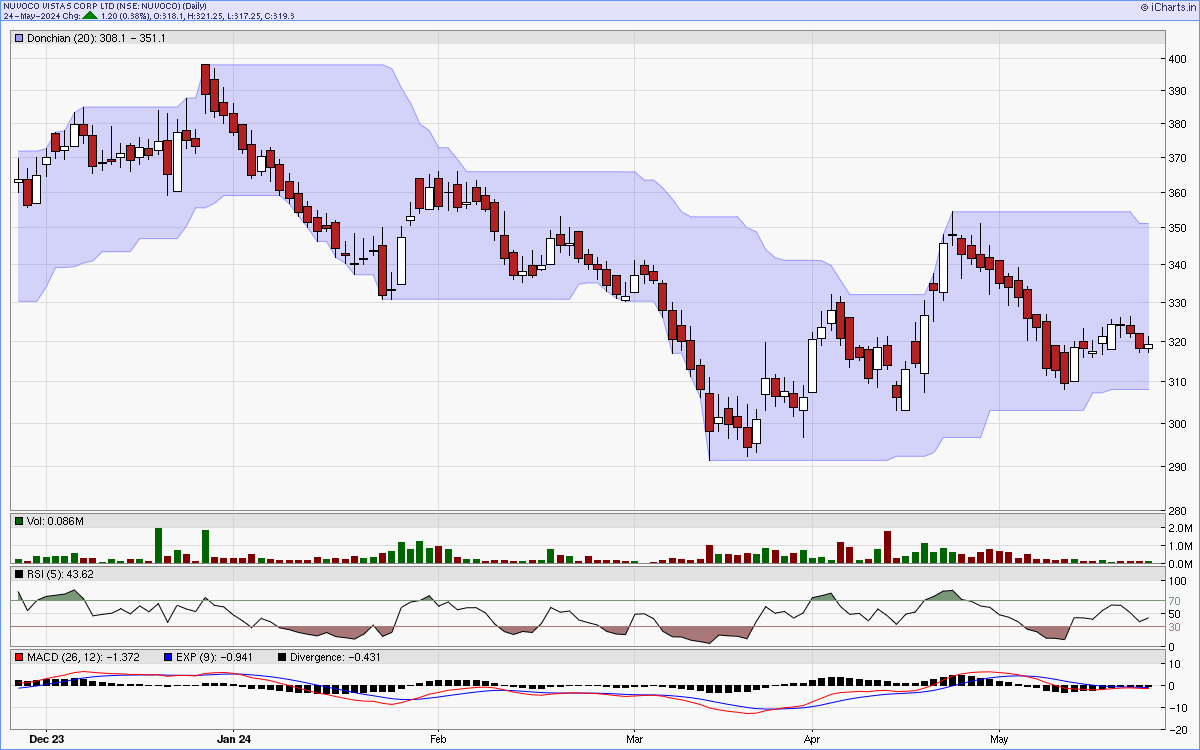
Six months candlestick chart
Charts courtsey: iCharts.in
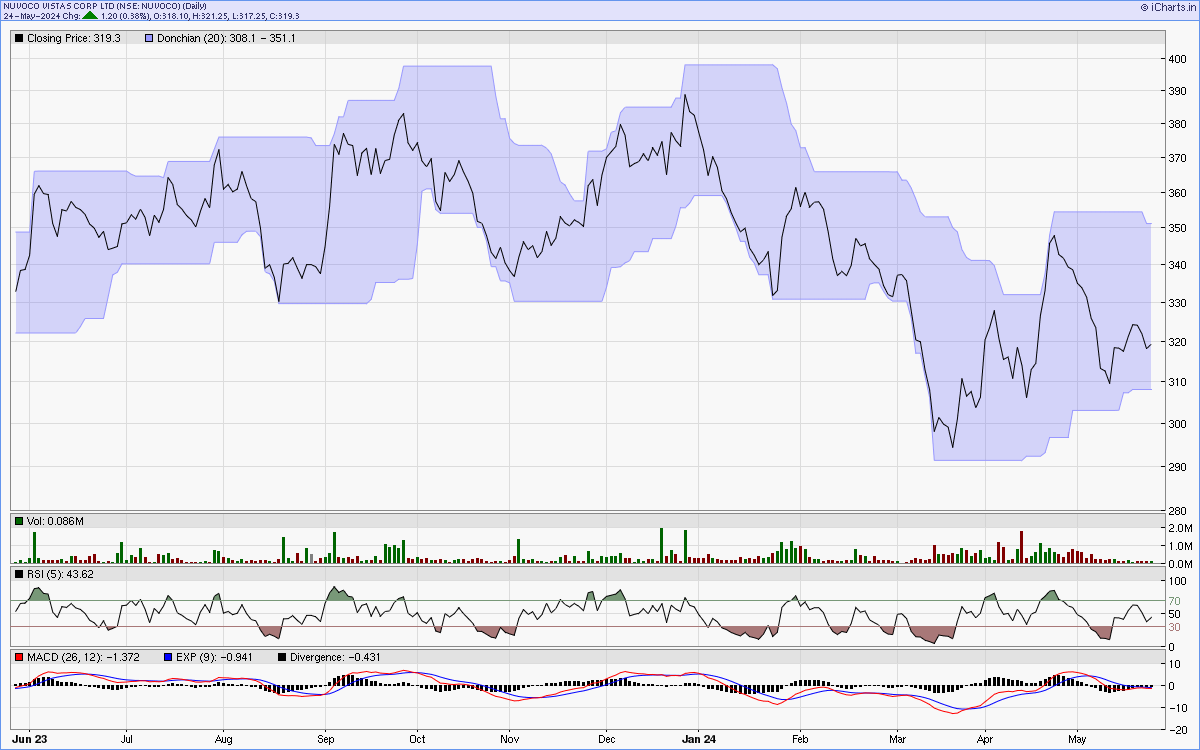
One year line chart
Two years weekly chart
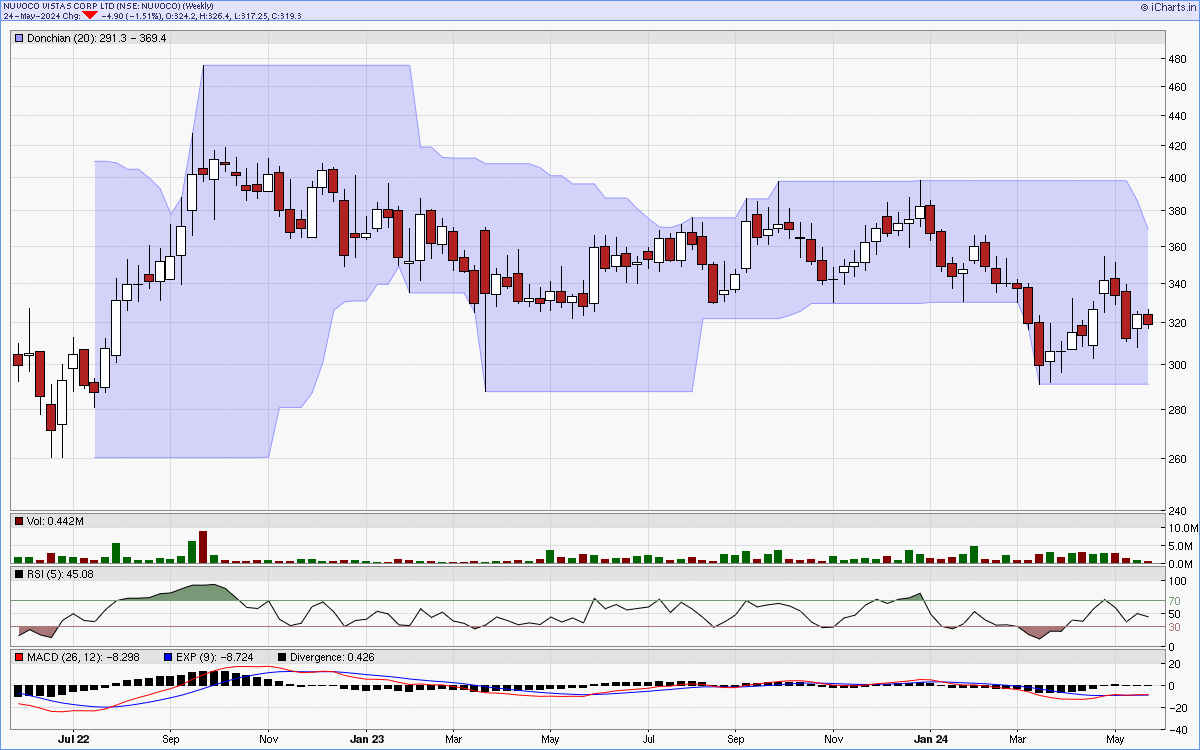
Charts courtsey: iCharts.in