Price / Percentage change:
| Open | High | Low | Close |
| Latest | 150.00 | 150.85 | 142.25 | 145.70 |
| Prev day | 135.60 | 154.80 | 135.35 | 150.00 |
| Last week | 134.70 | 154.80 | 132.00 | 150.00 |
| Last month | 114.40 | 142.40 | 113.40 | 132.70 |
| All time | | 154.80 | 13.75 | |
| 1 Day | 5 Day | 20 Day | 50 Day |
| -2.50% | 8.00% | 9.00% | 18.00% |
Trading range:
| TradingRange | Highest
Close | Lowest
Close | Highest
High | Lowest
Low |
| 5 days | 150.00 | 132.70 | 154.80 | 132.00 |
| 10 days | 150.00 | 132.70 | 154.80 | 131.15 |
| 20 days | 150.00 | 132.15 | 154.80 | 128.00 |
Trend analysis :
| Trend | First Signal | Price | Reversal | P SAR |
| BBB | 03-05-2024 | 150.00 | 128.00 | 132.10 |
| ATR (20d) | Williams R | RSI (5d) | RSI (14d) | Vol | Av Vol (20d) |
| 6.42 | 66 | 68 | 65 | 1226000 | 898000
|
Fibonacci price projections:
| 0% | 61.8% | 100% | 161.8% | 261.8% |
| Up | 128.00 | 136.90 | 142.40 | 151.30 | 165.70 |
| Dn | 142.40 | 133.50 | 128.00 | 119.10 | 104.70 |
Intraday pivot levels:
| Sup 2 | Sup 1 | Pivot | Res 1 | Res 2 |
| 137.65 | 141.65 | 146.25 | 150.25 | 154.85 |
Weekly pivot levels:
| Sup 2 | Sup 1 | Pivot | Res 1 | Res 2 |
| 122.75 | 136.35 | 145.60 | 159.20 | 168.40 |
Monthly pivot levels:
| Sup 2 | Sup 1 | Pivot | Res 1 | Res 2 |
| 100.50 | 116.60 | 129.50 | 145.60 | 158.50 |
Moving averages (simple):
| 5 Day | 20 Day | 50 Day | 200 Day |
| 140 | 136 | 129 |
110 |
Other levels:
| 52 Week Hi - Lo | Last Mnth Hi - Lo | Swing Hi - Lo | B Band Hi - Lo |
| 154.80 - 79.05 | 142.40 - 113.40 | 142.40 - 128.00 | 144.37 - 127.17 |
|
Charts...
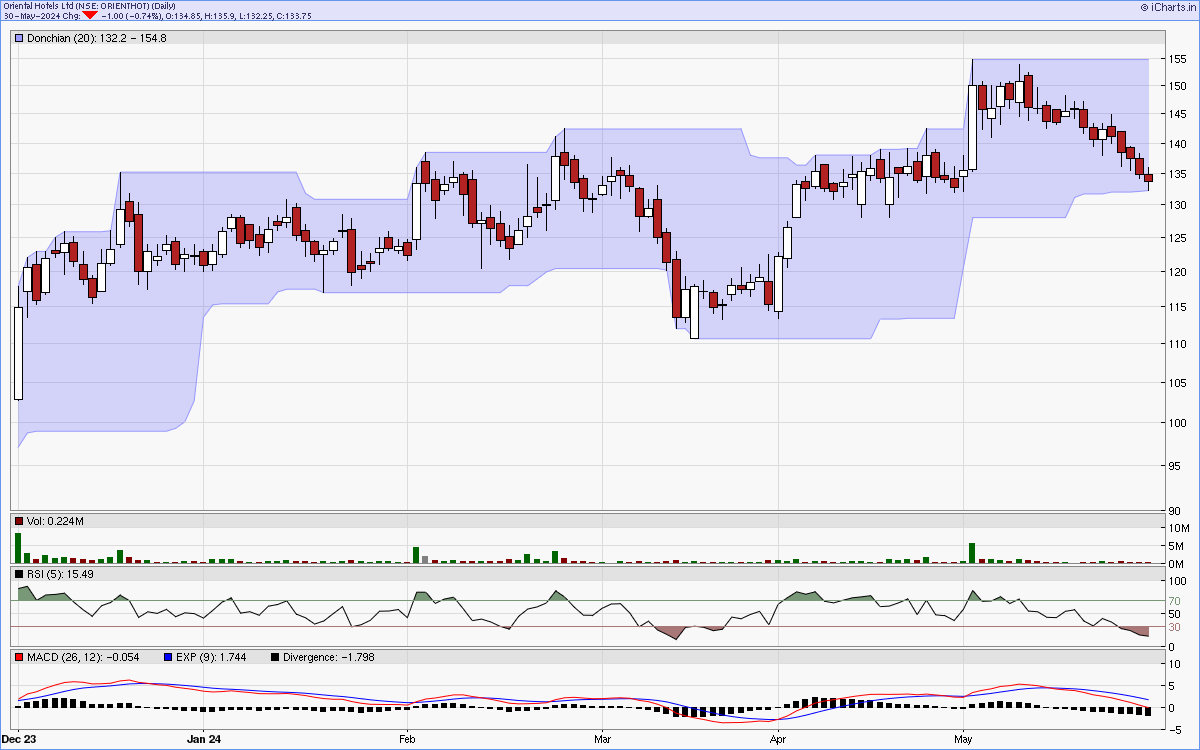
Six months candlestick chart
Charts courtsey: iCharts.in
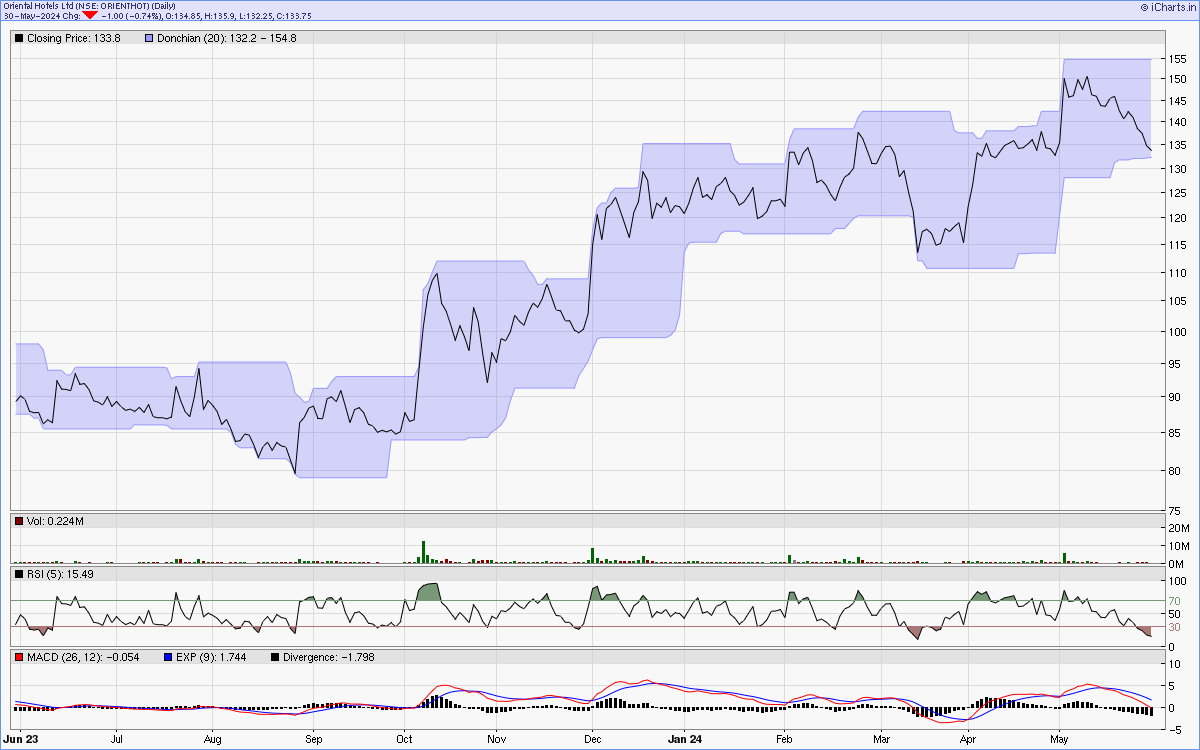
One year line chart
Two years weekly chart
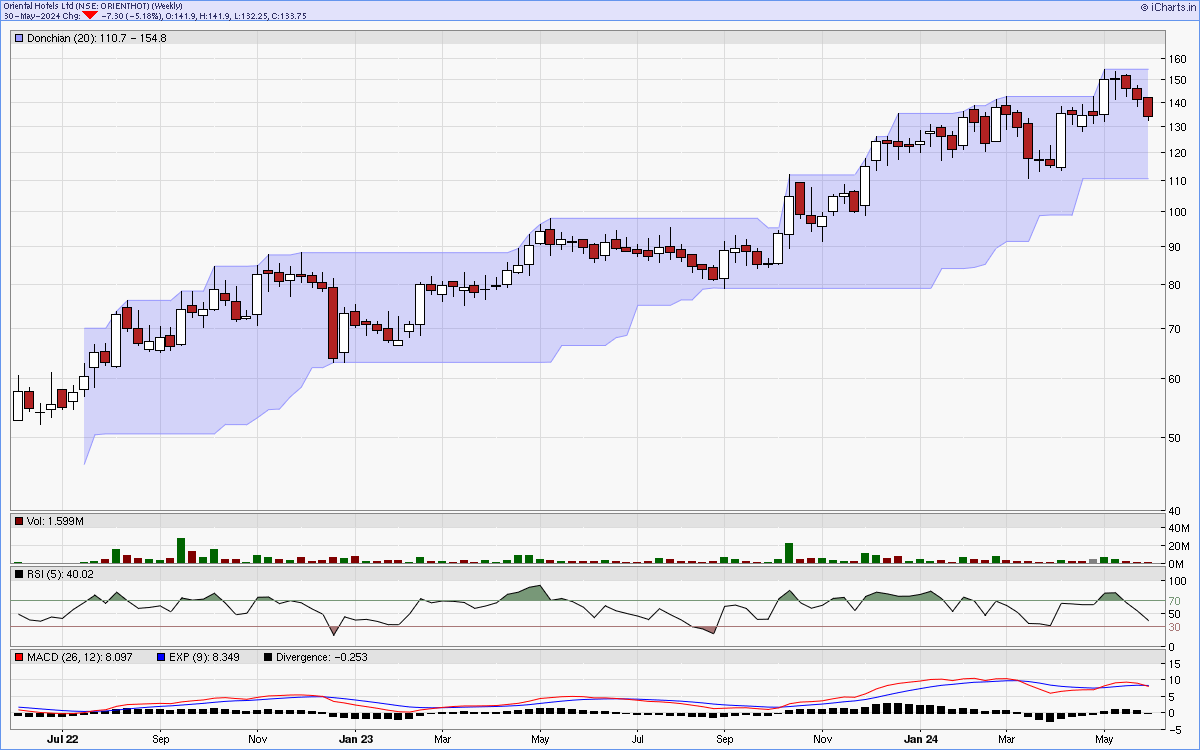
Charts courtsey: iCharts.in