Price / Percentage change:
| Open | High | Low | Close |
| Latest | 3426.60 | 3445.35 | 3361.00 | 3366.85 |
| Prev day | 3400.00 | 3428.90 | 3365.00 | 3407.70 |
| Last week | 3882.00 | 3882.00 | 3316.00 | 3397.45 |
| Last month | 4069.90 | 4085.05 | 3316.00 | 3368.60 |
| All time | | 4450.00 | 70.25 | |
| 1 Day | 5 Day | 20 Day | 50 Day |
| -1.00% | -1.50% | -15.00% | -22.50% |
Trading range:
| TradingRange | Highest
Close | Lowest
Close | Highest
High | Lowest
Low |
| 5 days | 3407.70 | 3366.85 | 3519.00 | 3341.00 |
| 10 days | 3884.70 | 3366.85 | 3909.95 | 3316.00 |
| 20 days | 4029.50 | 3366.85 | 4085.05 | 3316.00 |
Trend analysis :
| Trend | First Signal | Price | Reversal | P SAR |
| SSS | 05-03-2024 | 4124.17 | 4085.05 | 3660.76 |
| ATR (20d) | Williams R | RSI (5d) | RSI (14d) | Vol | Av Vol (20d) |
| 117.91 | 7 | 21 | 25 | 345000 | 736000
|
Fibonacci price projections:
| 0% | 61.8% | 100% | 161.8% | 261.8% |
| Up | 3316.00 | 4016.81 | 4450.00 | 5150.81 | 6284.81 |
| Dn | 4450.00 | 3749.19 | 3316.00 | 2615.19 | 1481.19 |
Intraday pivot levels:
| Sup 2 | Sup 1 | Pivot | Res 1 | Res 2 |
| 3306.70 | 3336.75 | 3391.05 | 3421.10 | 3475.40 |
Weekly pivot levels:
| Sup 2 | Sup 1 | Pivot | Res 1 | Res 2 |
| 2965.80 | 3181.60 | 3531.80 | 3747.60 | 4097.80 |
Monthly pivot levels:
| Sup 2 | Sup 1 | Pivot | Res 1 | Res 2 |
| 2820.75 | 3094.60 | 3589.85 | 3863.70 | 4358.90 |
Moving averages (simple):
| 5 Day | 20 Day | 50 Day | 200 Day |
| 3383 | 3709 | 3982 |
3356 |
Other levels:
| 52 Week Hi - Lo | Last Mnth Hi - Lo | Swing Hi - Lo | B Band Hi - Lo |
| 4450.00 - 2308.50 | 4085.05 - 3316.00 | 4450.00 - 3316.00 | 4231.20 - 3187.28 |
|
Charts...
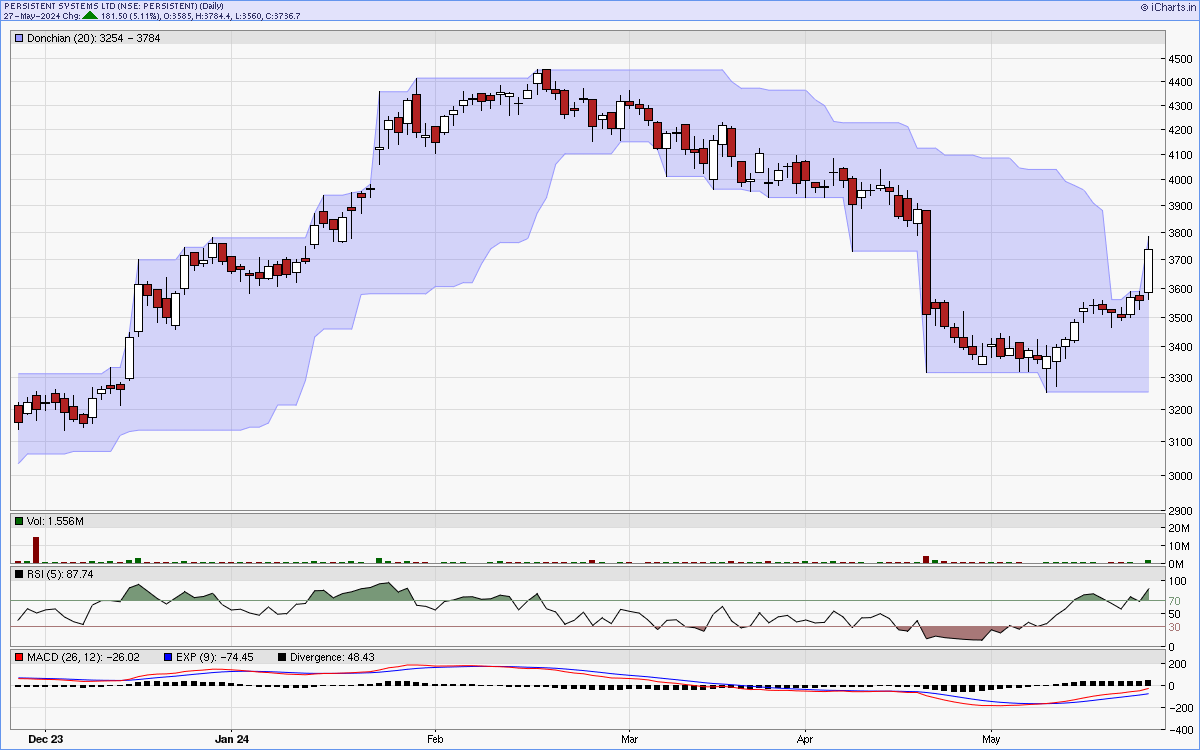
Six months candlestick chart
Charts courtsey: iCharts.in
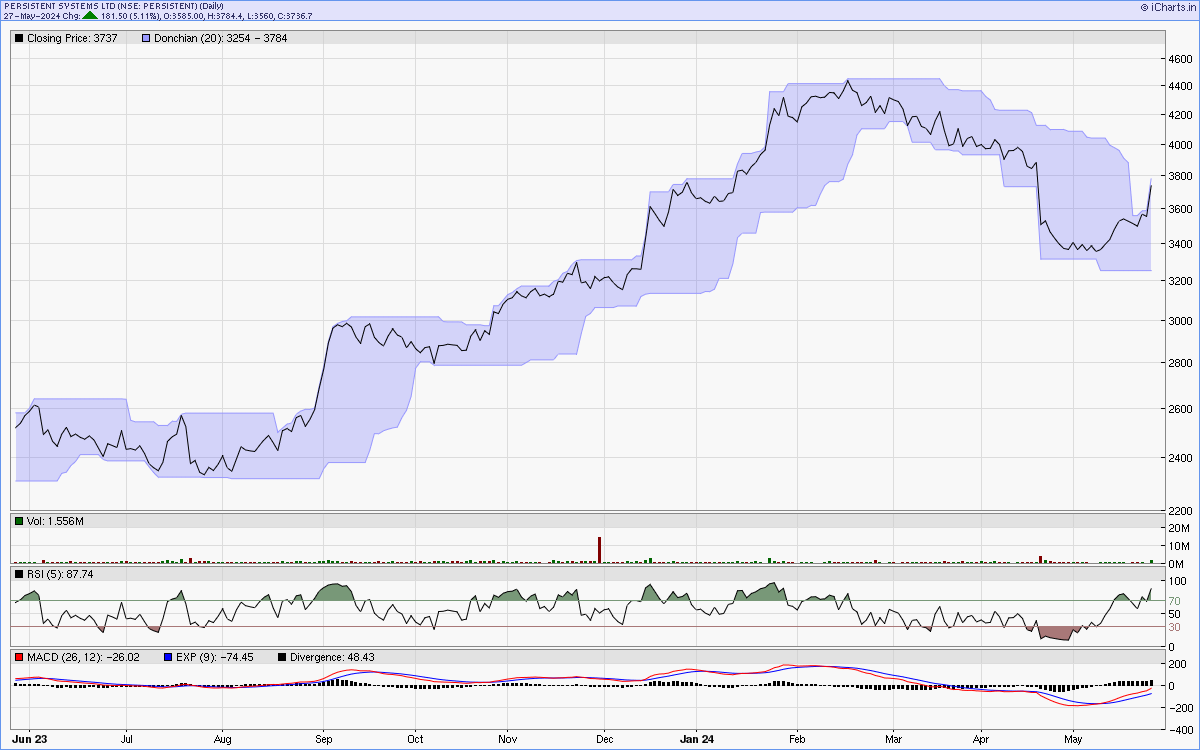
One year line chart
Two years weekly chart
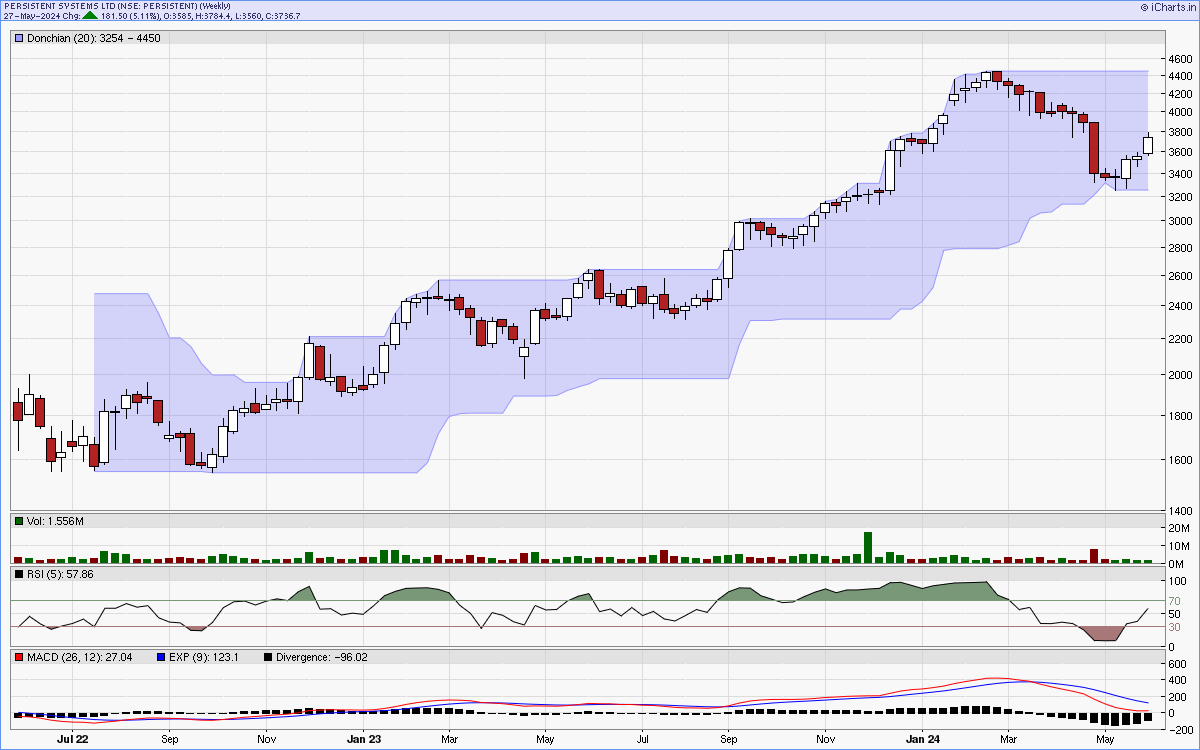
Charts courtsey: iCharts.in