Price / Percentage change:
| Open | High | Low | Close |
| Latest | 2250.20 | 2260.75 | 2115.70 | 2153.65 |
| Prev day | 2112.50 | 2262.50 | 2112.50 | 2228.70 |
| Last week | 1956.00 | 2124.95 | 1905.00 | 1958.35 |
| Last month | 1720.00 | 2149.00 | 1710.00 | 2108.75 |
| All time | | 2569.60 | 24.70 | |
| 1 Day | 5 Day | 20 Day | 50 Day |
| -3.00% | 7.50% | 19.50% | 16.50% |
Trading range:
| TradingRange | Highest
Close | Lowest
Close | Highest
High | Lowest
Low |
| 5 days | 2228.70 | 1958.35 | 2262.50 | 1945.00 |
| 10 days | 2228.70 | 1910.40 | 2262.50 | 1839.05 |
| 20 days | 2228.70 | 1797.95 | 2262.50 | 1765.00 |
Trend analysis :
| Trend | First Signal | Price | Reversal | P SAR |
| BBB | 18-04-2024 | 1890.60 | 1765.00 | 1961.62 |
| ATR (20d) | Williams R | RSI (5d) | RSI (14d) | Vol | Av Vol (20d) |
| 92.28 | 78 | 68 | 68 | 137000 | 102000
|
Fibonacci price projections:
| 0% | 61.8% | 100% | 161.8% | 261.8% |
| Up | 1544.25 | 1903.12 | 2124.95 | 2483.82 | 3064.52 |
| Dn | 2124.95 | 1766.08 | 1544.25 | 1185.38 | 604.68 |
Intraday pivot levels:
| Sup 2 | Sup 1 | Pivot | Res 1 | Res 2 |
| 2031.60 | 2092.60 | 2176.70 | 2237.70 | 2321.75 |
Weekly pivot levels:
| Sup 2 | Sup 1 | Pivot | Res 1 | Res 2 |
| 1776.10 | 1867.15 | 1996.05 | 2087.10 | 2216.00 |
Monthly pivot levels:
| Sup 2 | Sup 1 | Pivot | Res 1 | Res 2 |
| 1550.25 | 1829.50 | 1989.25 | 2268.50 | 2428.25 |
Moving averages (simple):
| 5 Day | 20 Day | 50 Day | 200 Day |
| 2091 | 1931 | 1811 |
1920 |
Other levels:
| 52 Week Hi - Lo | Last Mnth Hi - Lo | Swing Hi - Lo | B Band Hi - Lo |
| 2569.60 - 1422.85 | 2149.00 - 1710.00 | 2124.95 - 1544.25 | 2179.48 - 1681.98 |
|
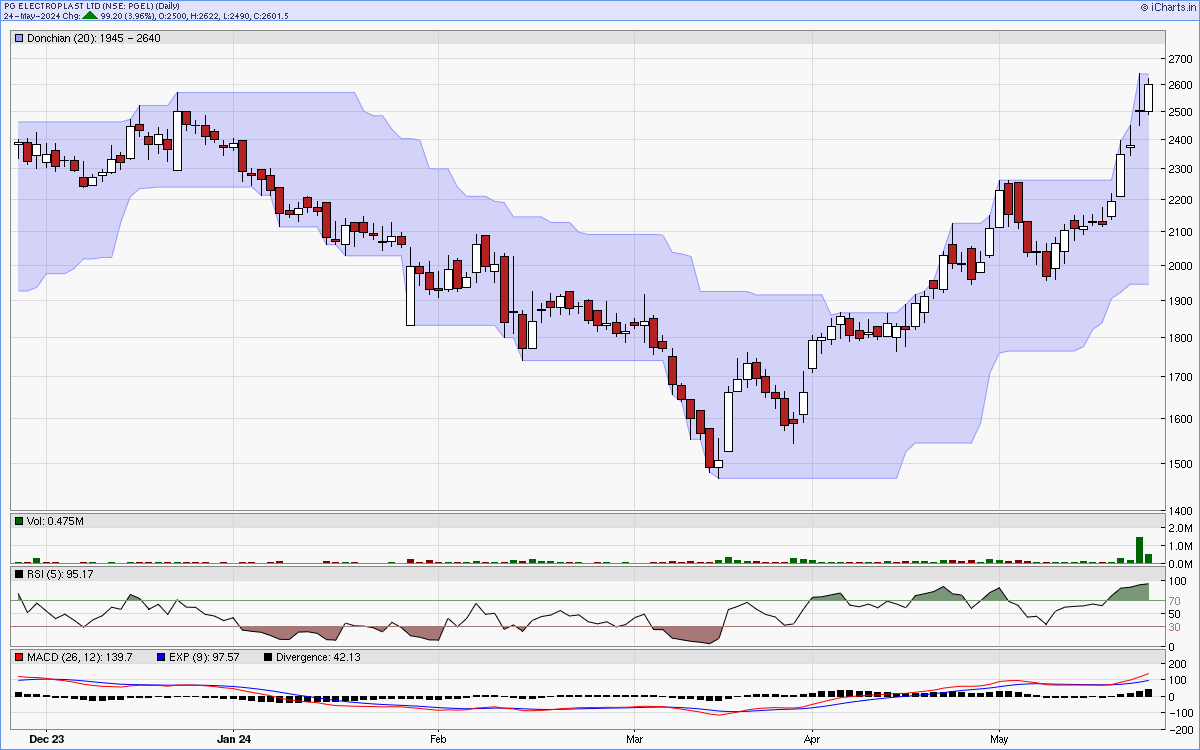
Charts...
Six months candlestick chart
Charts courtsey: iCharts.in
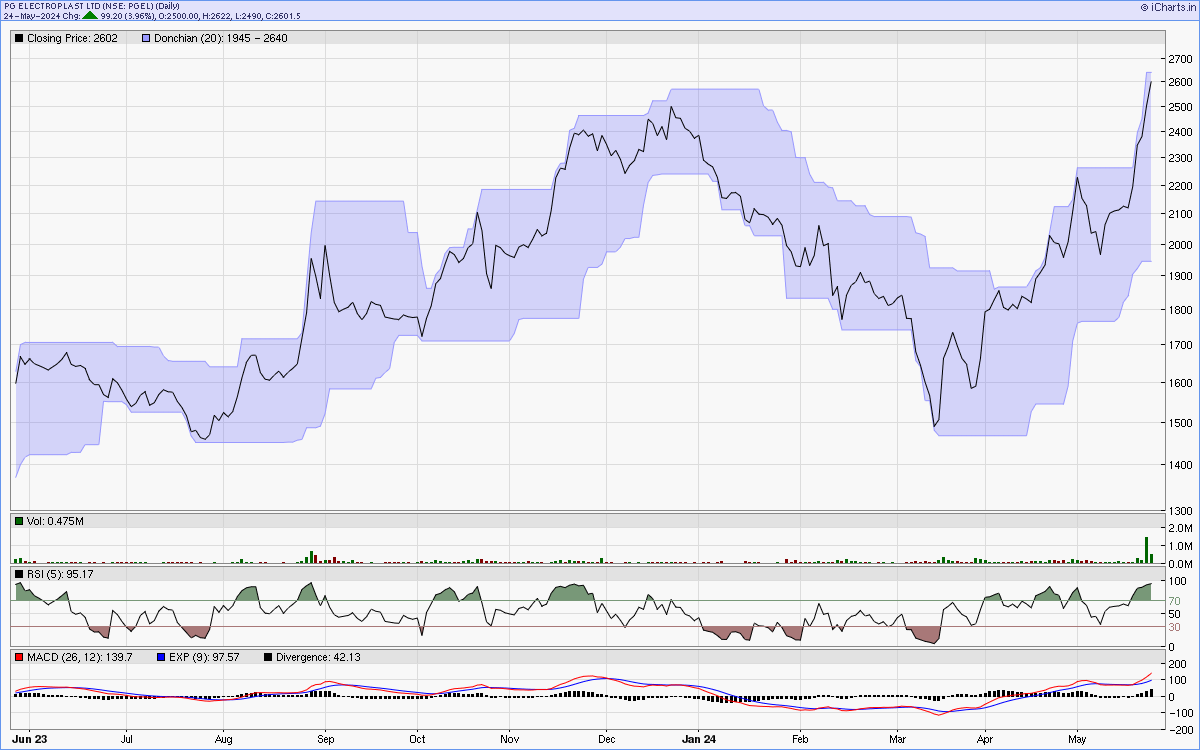
One year line chart
Two years weekly chart
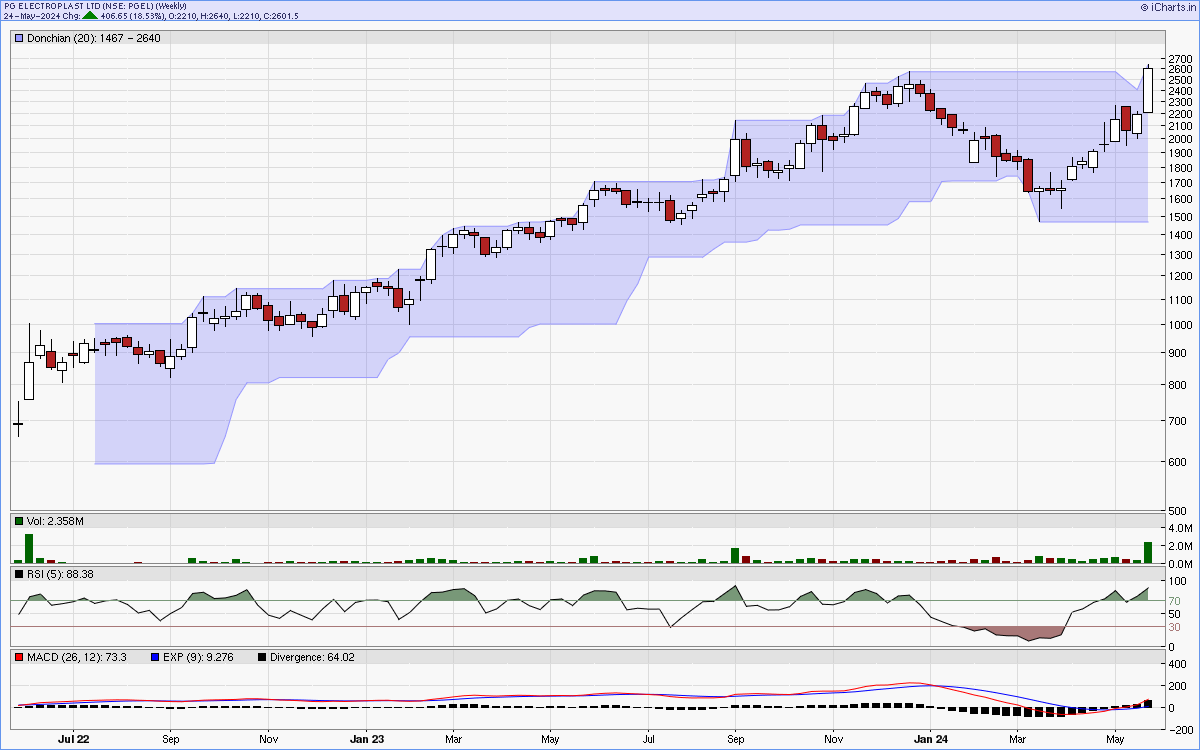
Charts courtsey: iCharts.in