Price / Percentage change:
| Open | High | Low | Close |
| Latest | 226.05 | 233.00 | 221.05 | 230.45 |
| Prev day | 229.85 | 230.80 | 223.40 | 224.70 |
| Last week | 233.70 | 236.80 | 224.35 | 226.65 |
| Last month | 188.65 | 239.70 | 188.65 | 224.70 |
| All time | | 254.60 | 73.60 | |
| 1 Day | 5 Day | 20 Day | 50 Day |
| 2.50% | 0.00% | 19.50% | 20.50% |
Trading range:
| TradingRange | Highest
Close | Lowest
Close | Highest
High | Lowest
Low |
| 5 days | 230.45 | 224.70 | 234.50 | 221.05 |
| 10 days | 231.55 | 210.30 | 239.70 | 198.90 |
| 20 days | 231.55 | 196.95 | 239.70 | 191.30 |
Trend analysis :
| Trend | First Signal | Price | Reversal | P SAR |
| BBB | 16-04-2024 | 209.60 | 191.30 | 239.37 |
| ATR (20d) | Williams R | RSI (5d) | RSI (14d) | Vol | Av Vol (20d) |
| 9.79 | 80 | 70 | 68 | 3440000 | 3221000
|
Fibonacci price projections:
| 0% | 61.8% | 100% | 161.8% | 261.8% |
| Up | 198.90 | 224.11 | 239.70 | 264.91 | 305.71 |
| Dn | 239.70 | 214.49 | 198.90 | 173.69 | 132.89 |
Intraday pivot levels:
| Sup 2 | Sup 1 | Pivot | Res 1 | Res 2 |
| 216.20 | 223.30 | 228.15 | 235.25 | 240.10 |
Weekly pivot levels:
| Sup 2 | Sup 1 | Pivot | Res 1 | Res 2 |
| 216.80 | 221.70 | 229.25 | 234.15 | 241.70 |
Monthly pivot levels:
| Sup 2 | Sup 1 | Pivot | Res 1 | Res 2 |
| 166.60 | 195.60 | 217.65 | 246.65 | 268.70 |
Moving averages (simple):
| 5 Day | 20 Day | 50 Day | 200 Day |
| 228 | 213 | 199 |
168 |
Other levels:
| 52 Week Hi - Lo | Last Mnth Hi - Lo | Swing Hi - Lo | B Band Hi - Lo |
| 254.60 - 91.20 | 239.70 - 188.65 | 239.70 - 198.90 | 240.00 - 186.53 |
|
Charts...
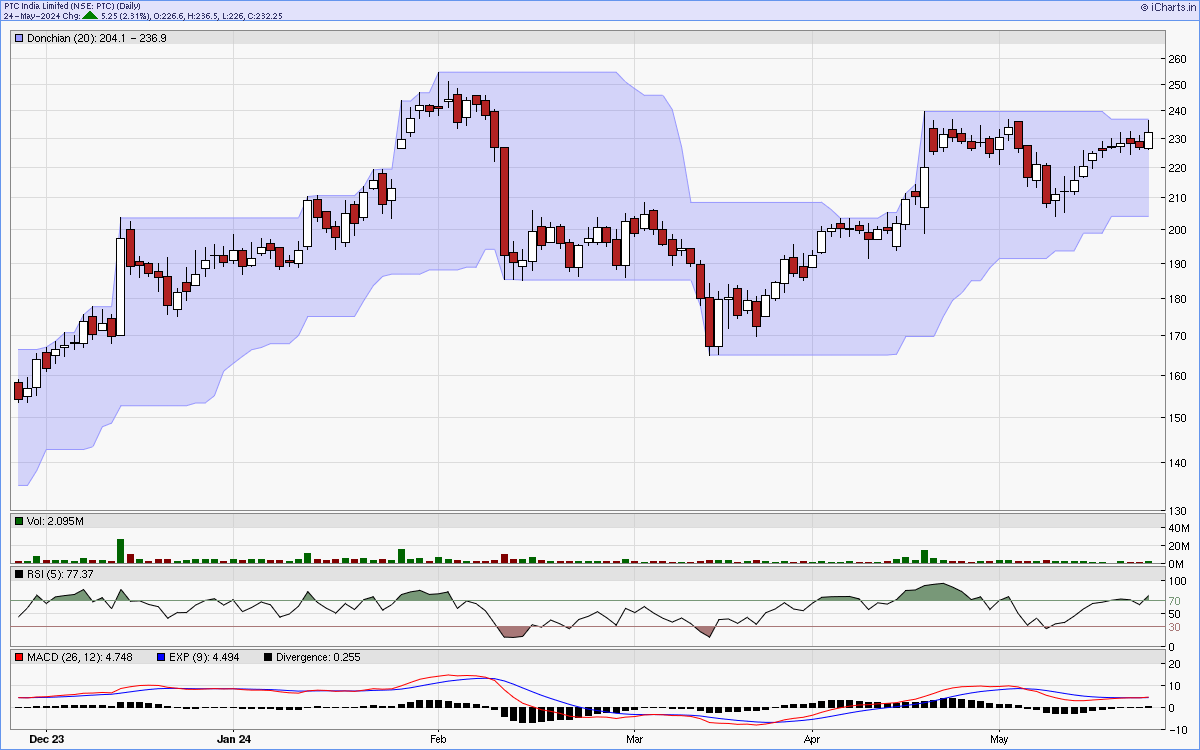
Six months candlestick chart
Charts courtsey: iCharts.in
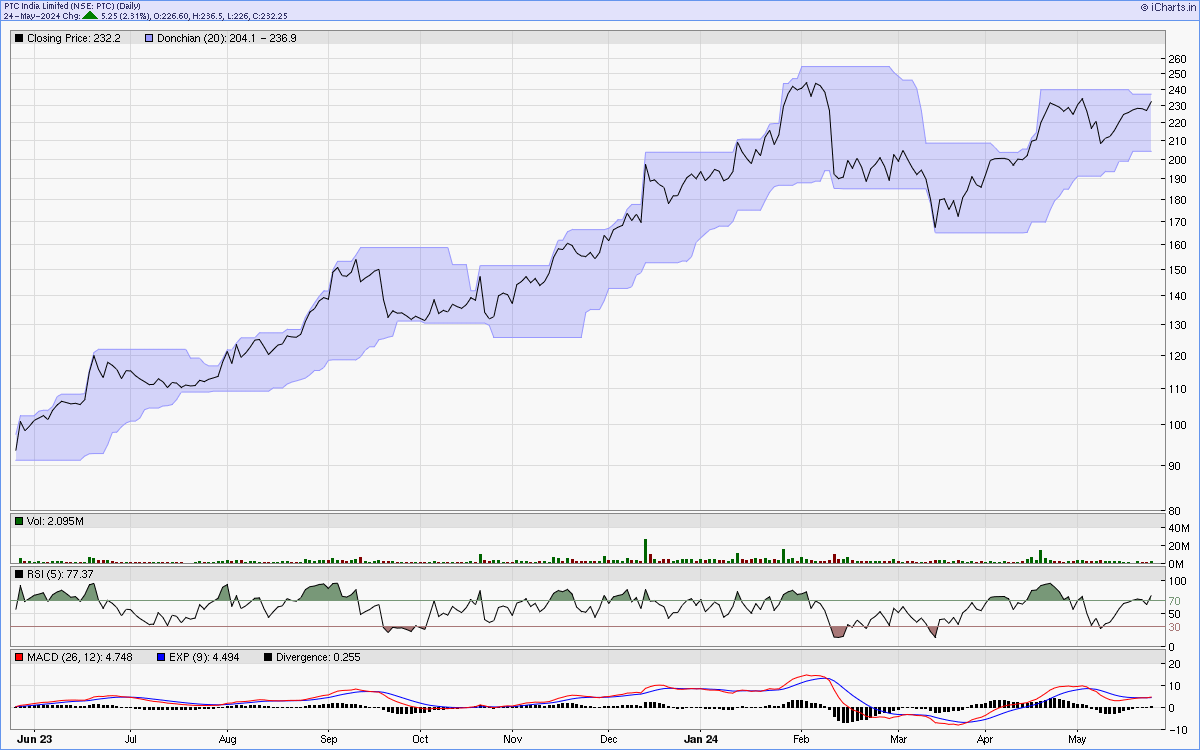
One year line chart
Two years weekly chart
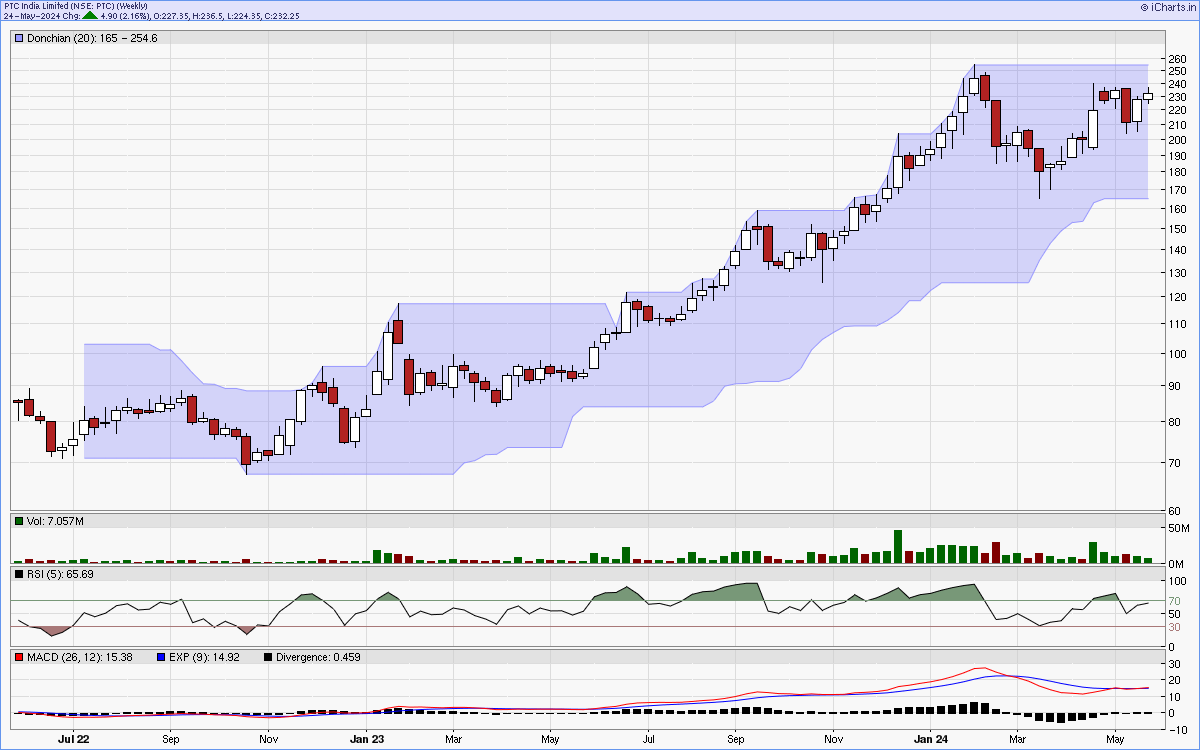
Charts courtsey: iCharts.in