Price / Percentage change:
| Open | High | Low | Close |
| Latest | 528.00 | 534.40 | 516.95 | 522.25 |
| Prev day | 517.65 | 522.15 | 509.90 | 520.20 |
| Last week | 505.40 | 535.00 | 504.05 | 530.10 |
| Last month | 415.00 | 543.00 | 410.00 | 520.20 |
| All time | | 924.00 | 90.35 | |
| 1 Day | 5 Day | 20 Day | 50 Day |
| 0.00% | 1.00% | 17.50% | 9.50% |
Trading range:
| TradingRange | Highest
Close | Lowest
Close | Highest
High | Lowest
Low |
| 5 days | 530.10 | 517.00 | 543.00 | 508.55 |
| 10 days | 530.10 | 469.10 | 543.00 | 455.00 |
| 20 days | 530.10 | 437.90 | 543.00 | 433.00 |
Trend analysis :
| Trend | First Signal | Price | Reversal | P SAR |
| BBB | 03-04-2024 | 453.00 | 433.00 | 490.89 |
| ATR (20d) | Williams R | RSI (5d) | RSI (14d) | Vol | Av Vol (20d) |
| 22.21 | 81 | 70 | 68 | 141000 | 339000
|
Fibonacci price projections:
| 0% | 61.8% | 100% | 161.8% | 261.8% |
| Up | 366.50 | 475.58 | 543.00 | 652.08 | 828.58 |
| Dn | 543.00 | 433.92 | 366.50 | 257.42 | 80.92 |
Intraday pivot levels:
| Sup 2 | Sup 1 | Pivot | Res 1 | Res 2 |
| 507.05 | 514.60 | 524.50 | 532.05 | 541.90 |
Weekly pivot levels:
| Sup 2 | Sup 1 | Pivot | Res 1 | Res 2 |
| 492.10 | 511.05 | 523.05 | 542.05 | 554.00 |
Monthly pivot levels:
| Sup 2 | Sup 1 | Pivot | Res 1 | Res 2 |
| 358.05 | 439.10 | 491.05 | 572.10 | 624.05 |
Moving averages (simple):
| 5 Day | 20 Day | 50 Day | 200 Day |
| 522 | 480 | 448 |
405 |
Other levels:
| 52 Week Hi - Lo | Last Mnth Hi - Lo | Swing Hi - Lo | B Band Hi - Lo |
| 543.00 - 193.95 | 543.00 - 410.00 | 543.00 - 366.50 | 548.98 - 410.99 |
|
Charts...
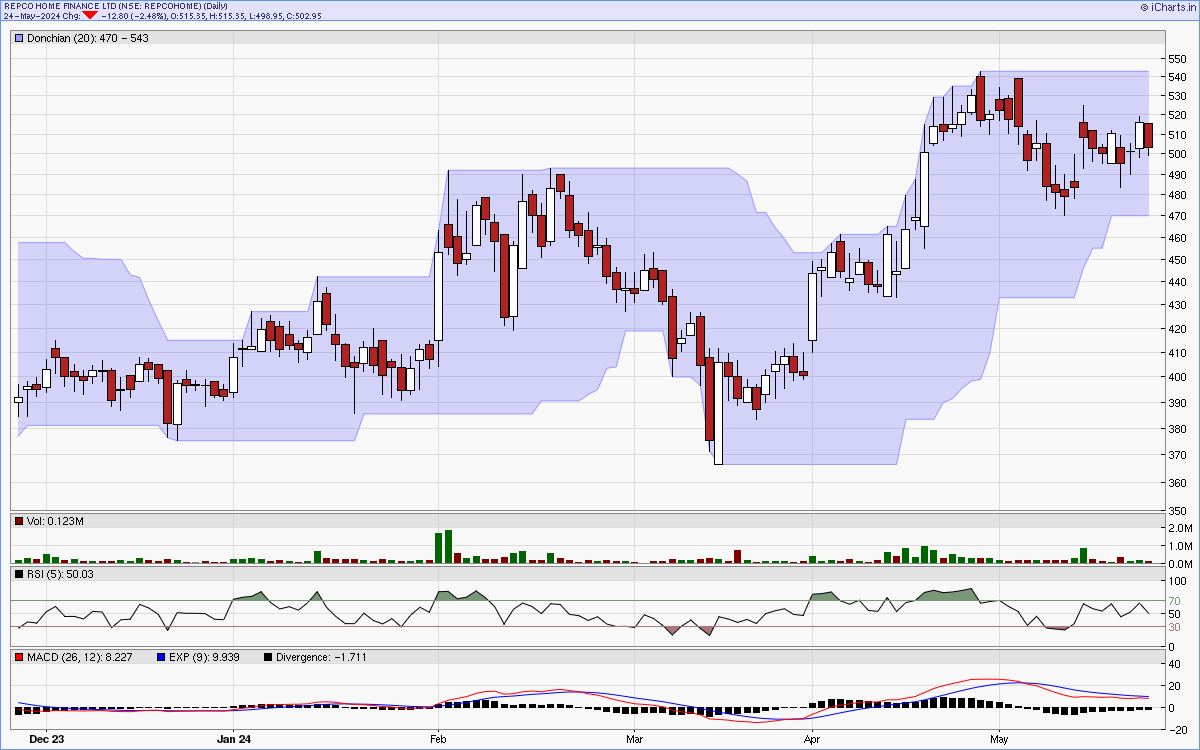
Six months candlestick chart
Charts courtsey: iCharts.in
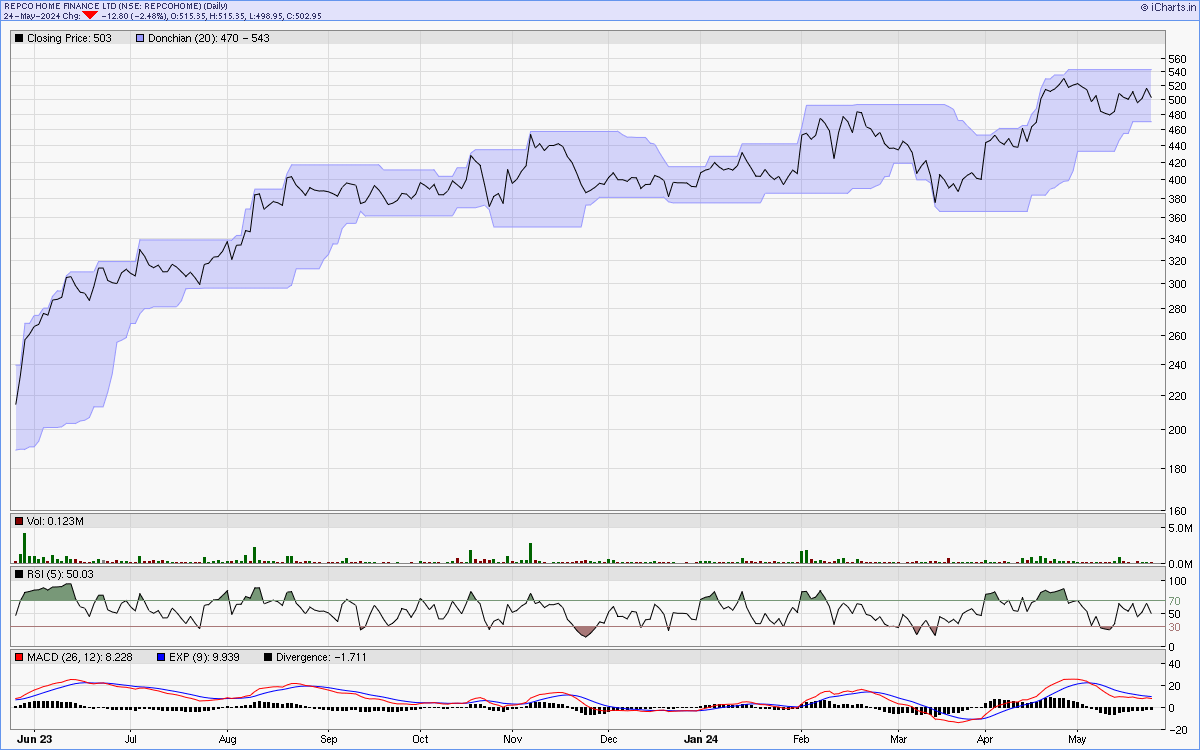
One year line chart
Two years weekly chart
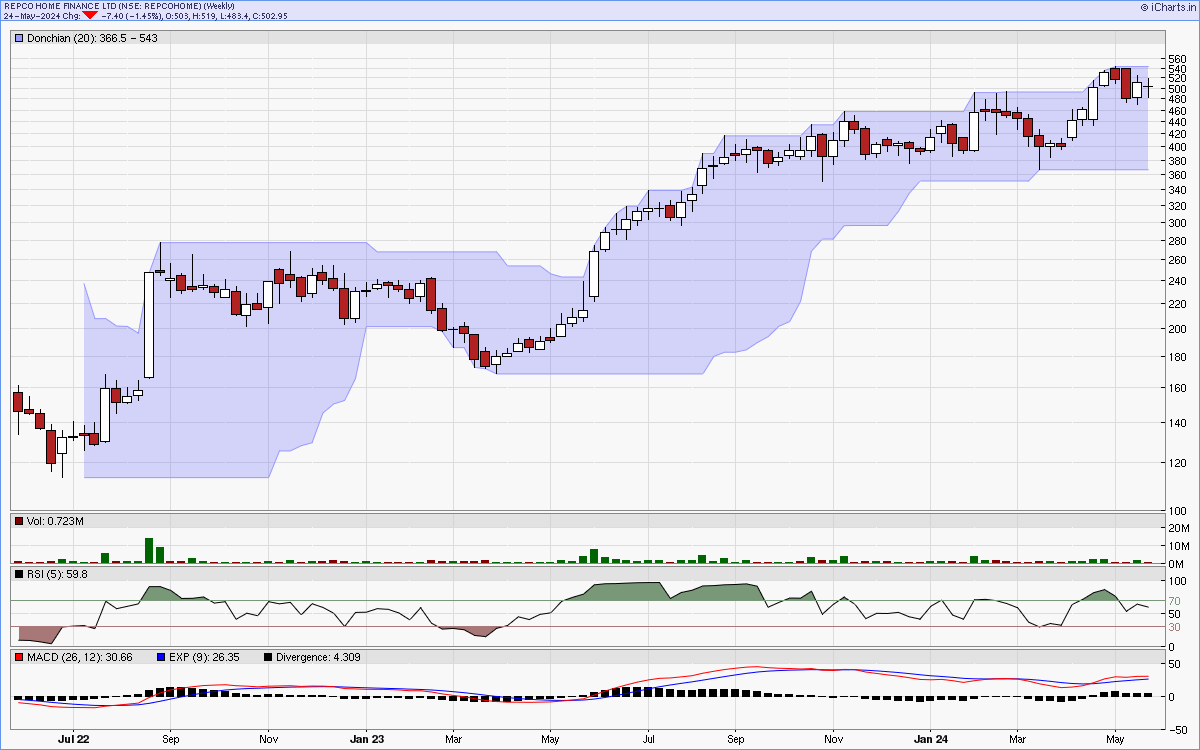
Charts courtsey: iCharts.in