Price / Percentage change:
| Open | High | Low | Close |
| Latest | 652.00 | 652.00 | 635.00 | 642.85 |
| Prev day | 653.00 | 653.80 | 641.15 | 644.85 |
| Last week | 644.00 | 664.30 | 636.15 | 641.10 |
| Last month | 558.10 | 688.00 | 556.90 | 650.25 |
| All time | | 892.90 | 22.85 | |
| 1 Day | 5 Day | 20 Day | 50 Day |
| 0.00% | 0.00% | 10.50% | -3.00% |
Trading range:
| TradingRange | Highest
Close | Lowest
Close | Highest
High | Lowest
Low |
| 5 days | 650.25 | 633.85 | 688.00 | 630.00 |
| 10 days | 659.80 | 633.85 | 688.00 | 622.10 |
| 20 days | 659.80 | 598.30 | 688.00 | 576.35 |
Trend analysis :
| Trend | First Signal | Price | Reversal | P SAR |
| BBB | 03-04-2024 | 598.30 | 576.35 | 688.00 |
| ATR (20d) | Williams R | RSI (5d) | RSI (14d) | Vol | Av Vol (20d) |
| 21.49 | 54 | 51 | 59 | 58000 | 338000
|
Fibonacci price projections:
| 0% | 61.8% | 100% | 161.8% | 261.8% |
| Up | 590.00 | 650.56 | 688.00 | 748.56 | 846.56 |
| Dn | 688.00 | 627.44 | 590.00 | 529.44 | 431.44 |
Intraday pivot levels:
| Sup 2 | Sup 1 | Pivot | Res 1 | Res 2 |
| 626.25 | 634.50 | 643.25 | 651.50 | 660.25 |
Weekly pivot levels:
| Sup 2 | Sup 1 | Pivot | Res 1 | Res 2 |
| 619.00 | 630.00 | 647.15 | 658.15 | 675.30 |
Monthly pivot levels:
| Sup 2 | Sup 1 | Pivot | Res 1 | Res 2 |
| 500.60 | 575.40 | 631.70 | 706.50 | 762.80 |
Moving averages (simple):
| 5 Day | 20 Day | 50 Day | 200 Day |
| 643 | 633 | 594 |
688 |
Other levels:
| 52 Week Hi - Lo | Last Mnth Hi - Lo | Swing Hi - Lo | B Band Hi - Lo |
| 824.00 - 504.25 | 688.00 - 556.90 | 688.00 - 590.00 | 668.23 - 597.05 |
|
Charts...
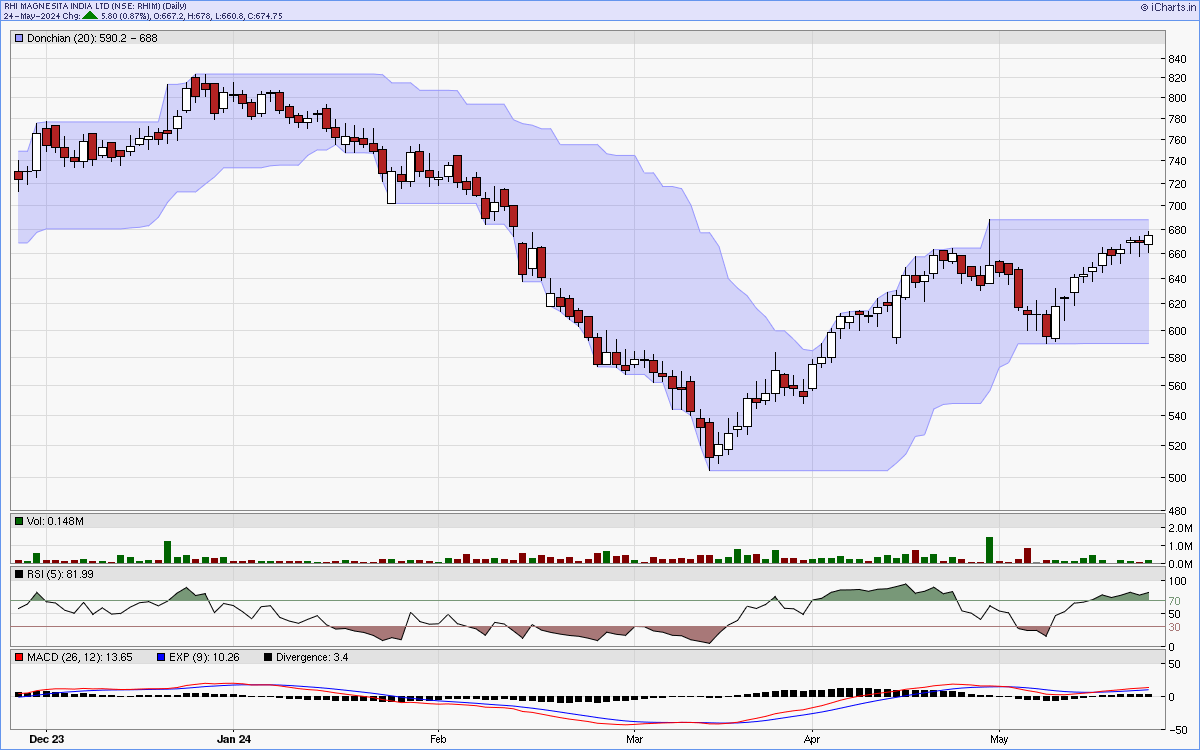
Six months candlestick chart
Charts courtsey: iCharts.in
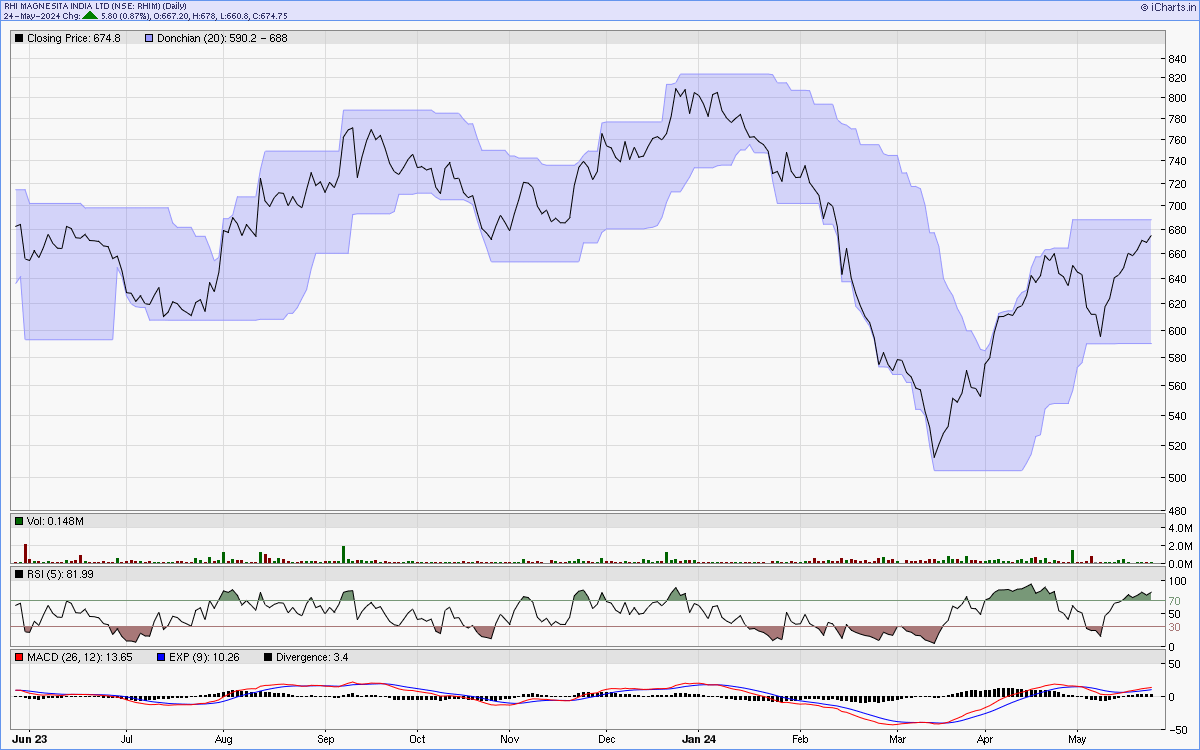
One year line chart
Two years weekly chart
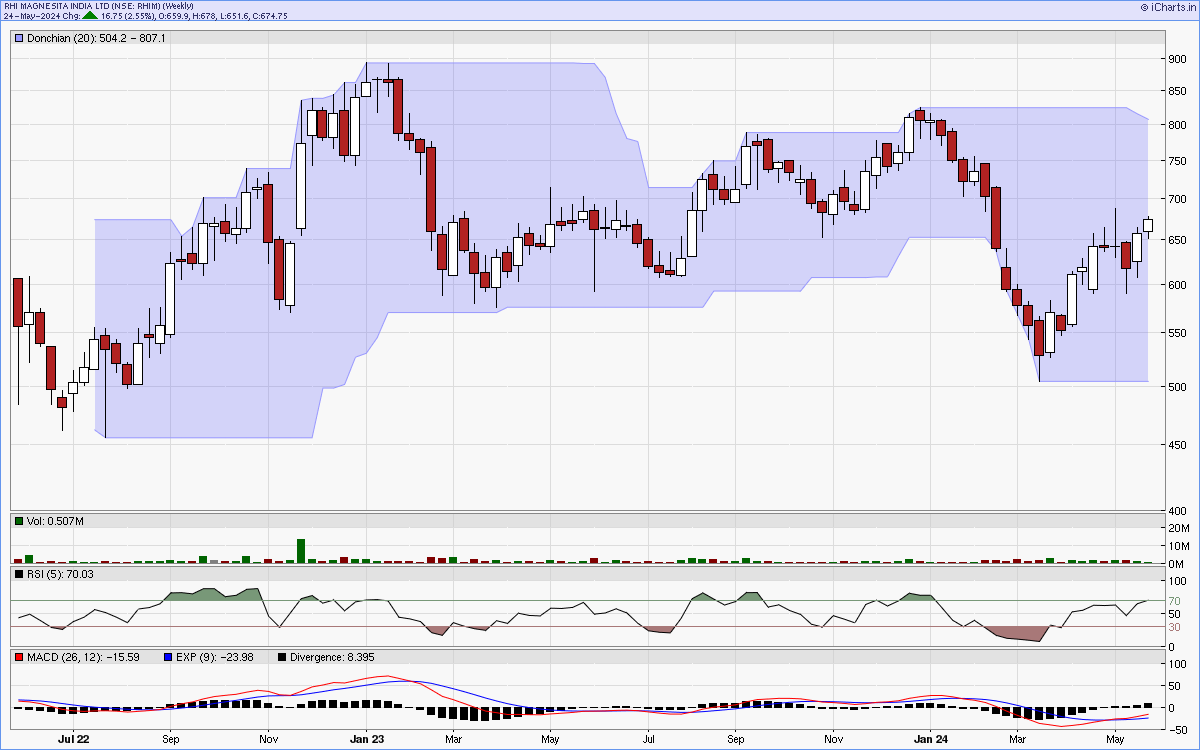
Charts courtsey: iCharts.in