Price / Percentage change:
| Open | High | Low | Close |
| Latest | 160.35 | 162.95 | 152.75 | 156.20 |
| Prev day | 163.45 | 166.90 | 157.05 | 159.20 |
| Last week | 147.80 | 166.90 | 147.75 | 159.20 |
| Last month | 124.05 | 165.00 | 123.90 | 160.15 |
| All time | | 166.90 | 65.80 | |
| 1 Day | 5 Day | 20 Day | 50 Day |
| -1.50% | 6.00% | 18.50% | 18.50% |
Trading range:
| TradingRange | Highest
Close | Lowest
Close | Highest
High | Lowest
Low |
| 5 days | 162.30 | 156.20 | 166.90 | 147.75 |
| 10 days | 162.30 | 146.10 | 166.90 | 141.55 |
| 20 days | 162.30 | 131.55 | 166.90 | 128.80 |
Trend analysis :
| Trend | First Signal | Price | Reversal | P SAR |
| BBB | 09-04-2024 | 143.35 | 128.80 | 140.25 |
| ATR (20d) | Williams R | RSI (5d) | RSI (14d) | Vol | Av Vol (20d) |
| 7.44 | 67 | 57 | 64 | 602000 | 813000
|
Fibonacci price projections:
| 0% | 61.8% | 100% | 161.8% | 261.8% |
| Up | 134.30 | 145.79 | 152.90 | 164.39 | 182.99 |
| Dn | 152.90 | 141.41 | 134.30 | 122.81 | 104.21 |
Intraday pivot levels:
| Sup 2 | Sup 1 | Pivot | Res 1 | Res 2 |
| 147.05 | 151.55 | 157.25 | 161.75 | 167.45 |
Weekly pivot levels:
| Sup 2 | Sup 1 | Pivot | Res 1 | Res 2 |
| 138.75 | 148.95 | 157.95 | 168.10 | 177.10 |
Monthly pivot levels:
| Sup 2 | Sup 1 | Pivot | Res 1 | Res 2 |
| 108.55 | 134.30 | 149.65 | 175.40 | 190.75 |
Moving averages (simple):
| 5 Day | 20 Day | 50 Day | 200 Day |
| 160 | 146 | 135 |
103 |
Other levels:
| 52 Week Hi - Lo | Last Mnth Hi - Lo | Swing Hi - Lo | B Band Hi - Lo |
| 166.90 - 71.00 | 165.00 - 123.90 | 152.90 - 134.30 | 165.04 - 127.90 |
|
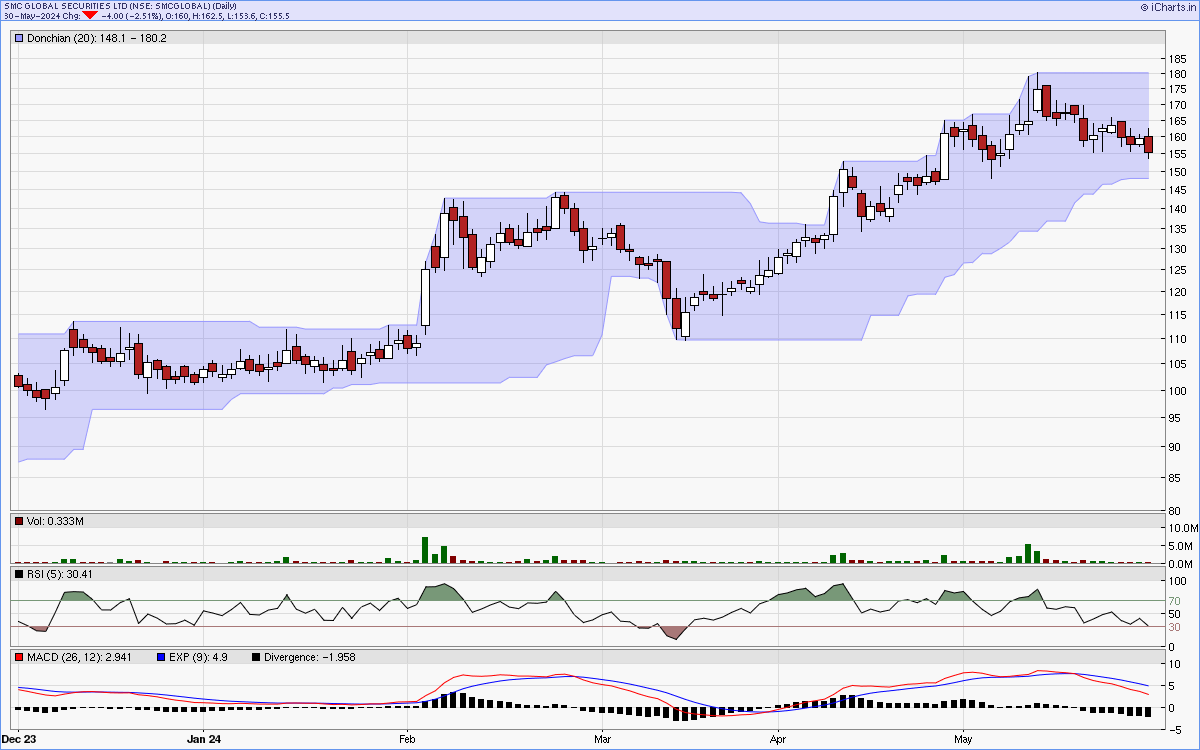
Charts...
Six months candlestick chart
Charts courtsey: iCharts.in
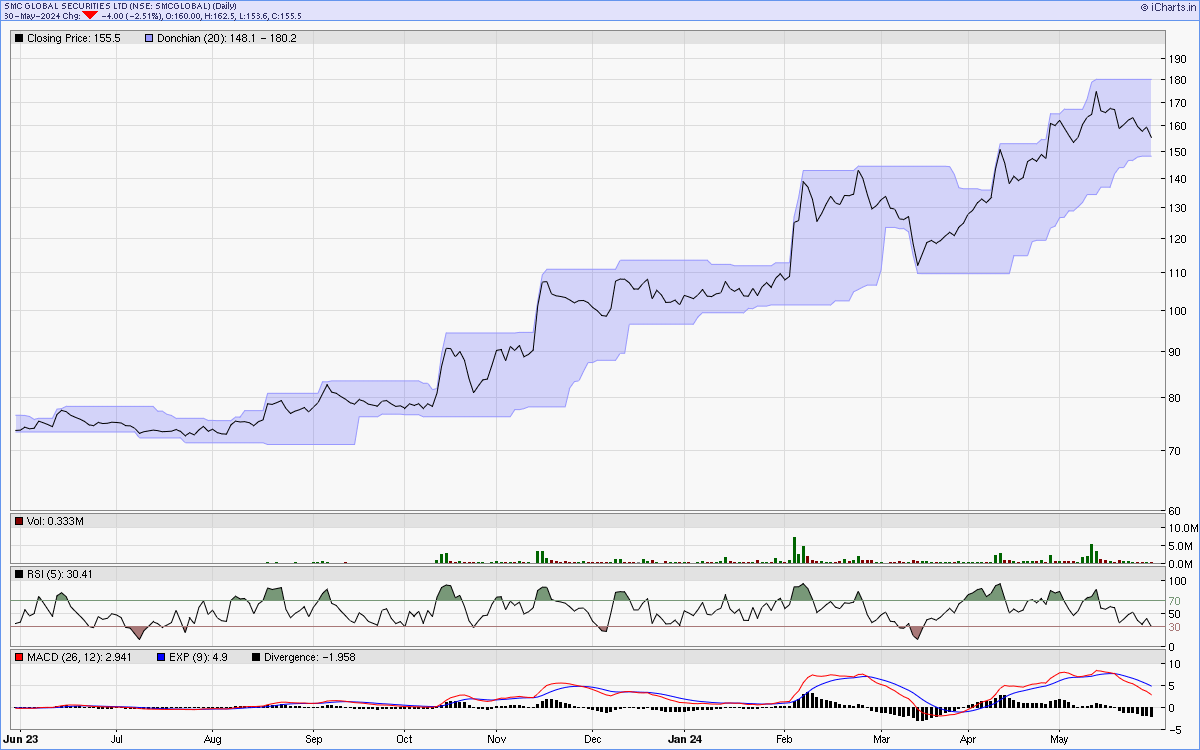
One year line chart
Two years weekly chart
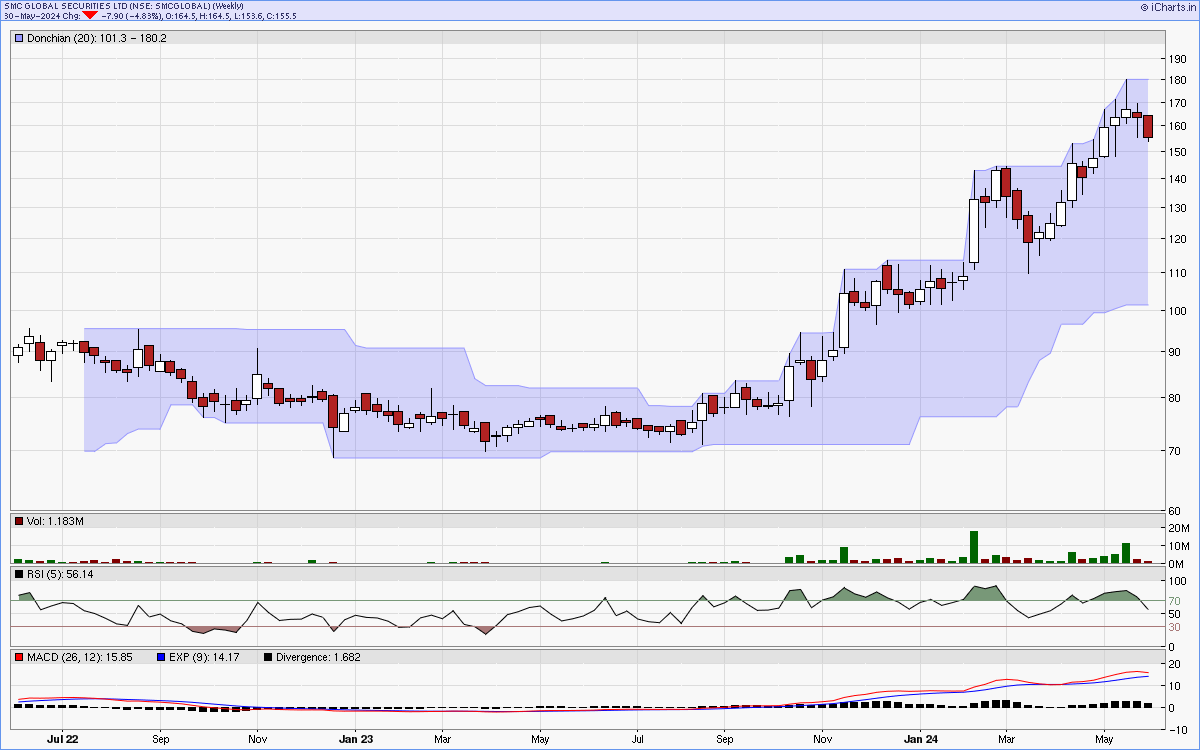
Charts courtsey: iCharts.in