Price / Percentage change:
| Open | High | Low | Close |
| Latest | 220.70 | 243.80 | 220.70 | 237.35 |
| Prev day | 232.30 | 232.30 | 232.30 | 232.30 |
| Last week | 315.95 | 315.95 | 257.35 | 257.35 |
| Last month | 365.20 | 472.80 | 232.30 | 232.30 |
| All time | | 598.00 | 39.00 | |
| 1 Day | 5 Day | 20 Day | 50 Day |
| 2.00% | -16.50% | -37.00% | -30.50% |
Trading range:
| TradingRange | Highest
Close | Lowest
Close | Highest
High | Lowest
Low |
| 5 days | 270.90 | 232.30 | 283.70 | 220.70 |
| 10 days | 350.05 | 232.30 | 350.05 | 220.70 |
| 20 days | 455.30 | 232.30 | 472.80 | 220.70 |
Trend analysis :
| Trend | First Signal | Price | Reversal | P SAR |
| SSS | 19-04-2024 | 332.55 | 472.80 | 314.82 |
| ATR (20d) | Williams R | RSI (5d) | RSI (14d) | Vol | Av Vol (20d) |
| 18.41 | 8 | 12 | 23 | 12163000 | 1792000
|
Today was a high volume day...
Fibonacci price projections:
| 0% | 61.8% | 100% | 161.8% | 261.8% |
| Up | 334.50 | 419.97 | 472.80 | 558.27 | 696.57 |
| Dn | 472.80 | 387.33 | 334.50 | 249.03 | 110.73 |
Intraday pivot levels:
| Sup 2 | Sup 1 | Pivot | Res 1 | Res 2 |
| 210.80 | 224.05 | 233.95 | 247.20 | 257.05 |
Weekly pivot levels:
| Sup 2 | Sup 1 | Pivot | Res 1 | Res 2 |
| 218.25 | 237.75 | 276.85 | 296.35 | 335.45 |
Monthly pivot levels:
| Sup 2 | Sup 1 | Pivot | Res 1 | Res 2 |
| 71.90 | 152.05 | 312.45 | 392.55 | 552.95 |
Moving averages (simple):
| 5 Day | 20 Day | 50 Day | 200 Day |
| 248 | 348 | 359 |
292 |
Other levels:
| 52 Week Hi - Lo | Last Mnth Hi - Lo | Swing Hi - Lo | B Band Hi - Lo |
| 472.80 - 178.80 | 472.80 - 232.30 | 472.80 - 334.50 | 494.35 - 200.89 |
|
Charts...
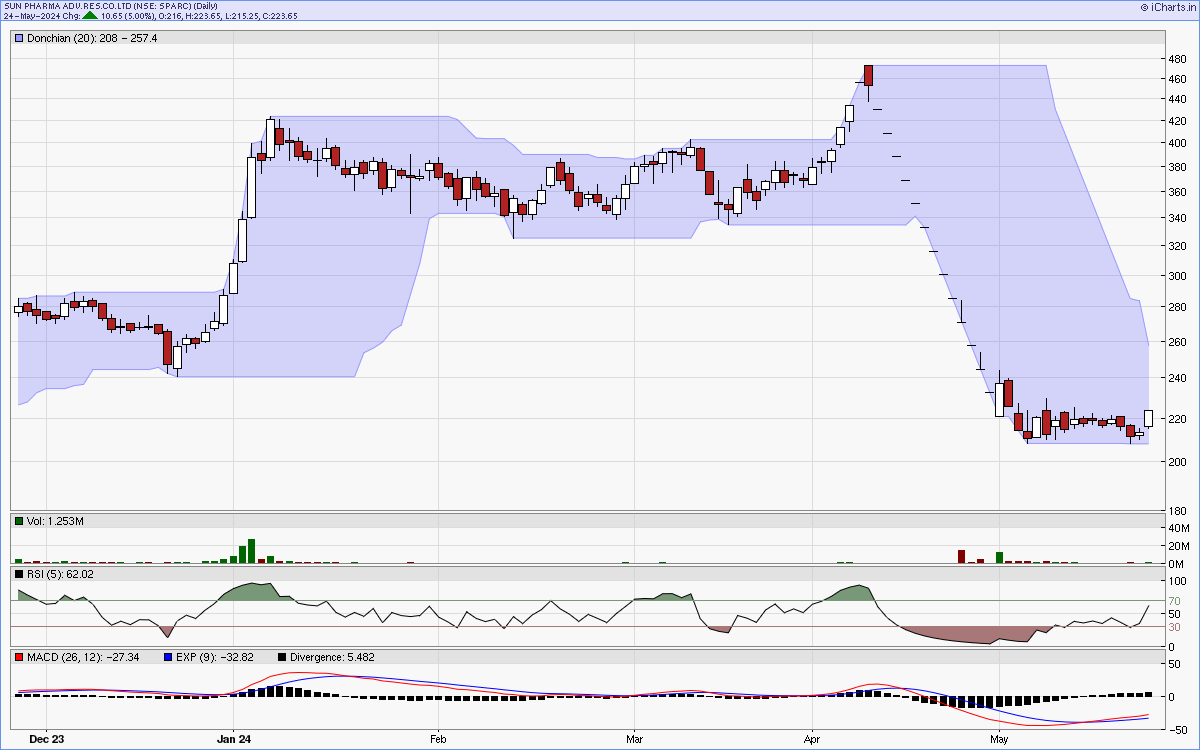
Six months candlestick chart
Charts courtsey: iCharts.in
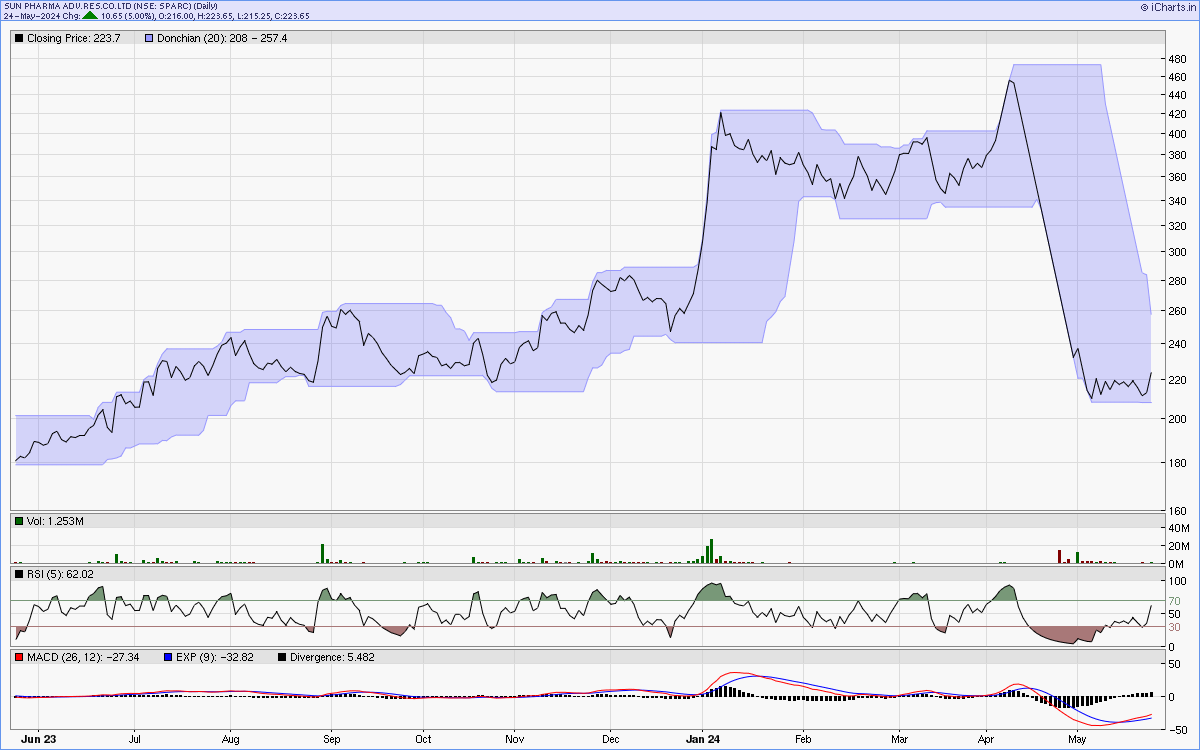
One year line chart
Two years weekly chart
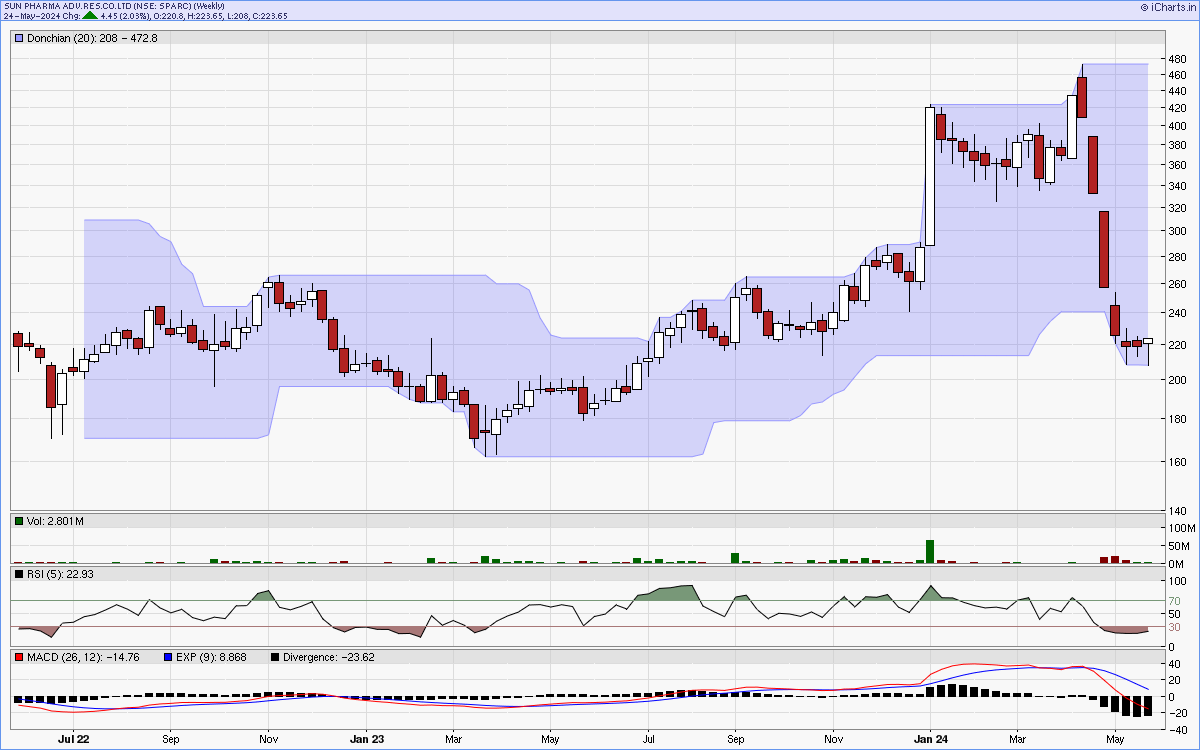
Charts courtsey: iCharts.in