Price / Percentage change:
| Open | High | Low | Close |
| Latest | 4900.00 | 4900.00 | 4809.75 | 4830.00 |
| Prev day | 4768.60 | 4959.00 | 4768.60 | 4853.25 |
| Last week | 4679.95 | 4886.40 | 4491.50 | 4794.10 |
| Last month | 4051.05 | 4886.40 | 4051.05 | 4745.95 |
| All time | | 4959.00 | 17.75 | |
| 1 Day | 5 Day | 20 Day | 50 Day |
| 0.00% | 0.50% | 14.50% | 28.50% |
Trading range:
| TradingRange | Highest
Close | Lowest
Close | Highest
High | Lowest
Low |
| 5 days | 4853.25 | 4745.95 | 4959.00 | 4665.05 |
| 10 days | 4853.25 | 4514.60 | 4959.00 | 4491.50 |
| 20 days | 4853.25 | 4199.10 | 4959.00 | 4155.30 |
Trend analysis :
| Trend | First Signal | Price | Reversal | P SAR |
| BBB | 11-09-2023 | 2659.20 | 4155.30 | 4630.33 |
| ATR (20d) | Williams R | RSI (5d) | RSI (14d) | Vol | Av Vol (20d) |
| 167.62 | 76 | 70 | 70 | 115000 | 179000
|
Fibonacci price projections:
| 0% | 61.8% | 100% | 161.8% | 261.8% |
| Up | 3622.25 | 4287.68 | 4699.00 | 5364.43 | 6441.18 |
| Dn | 4699.00 | 4033.57 | 3622.25 | 2956.82 | 1880.07 |
Intraday pivot levels:
| Sup 2 | Sup 1 | Pivot | Res 1 | Res 2 |
| 4756.30 | 4793.10 | 4846.55 | 4883.35 | 4936.80 |
Weekly pivot levels:
| Sup 2 | Sup 1 | Pivot | Res 1 | Res 2 |
| 4329.10 | 4561.60 | 4724.00 | 4956.50 | 5118.90 |
Monthly pivot levels:
| Sup 2 | Sup 1 | Pivot | Res 1 | Res 2 |
| 3725.75 | 4235.80 | 4561.10 | 5071.15 | 5396.45 |
Moving averages (simple):
| 5 Day | 20 Day | 50 Day | 200 Day |
| 4802 | 4593 | 4286 |
3428 |
Other levels:
| 52 Week Hi - Lo | Last Mnth Hi - Lo | Swing Hi - Lo | B Band Hi - Lo |
| 4959.00 - 2332.75 | 4886.40 - 4051.05 | 4699.00 - 3622.25 | 4965.17 - 4220.57 |
|
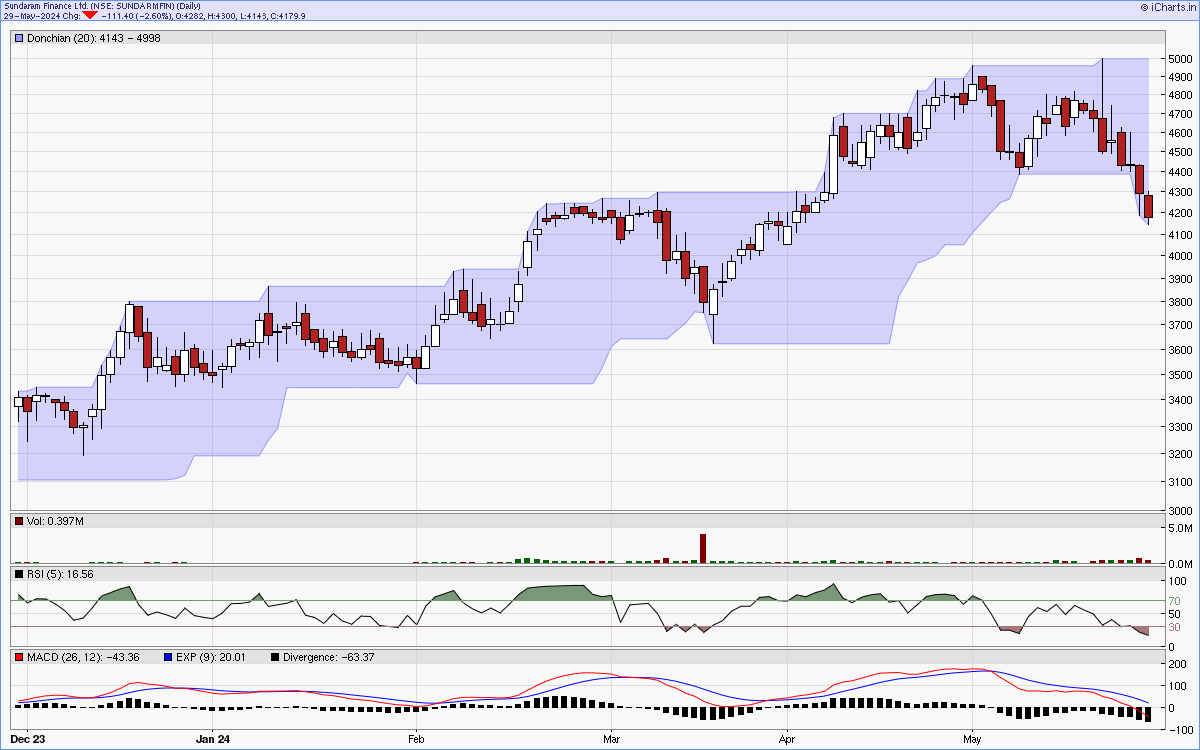
Charts...
Six months candlestick chart
Charts courtsey: iCharts.in
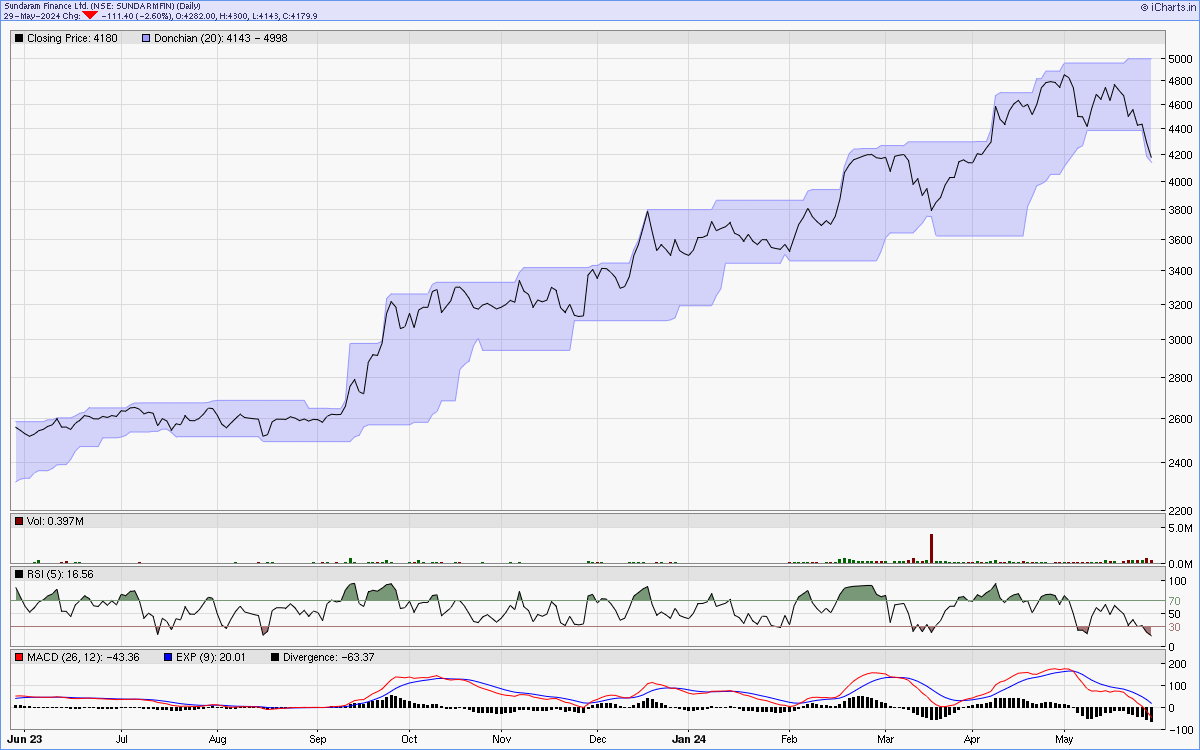
One year line chart
Two years weekly chart
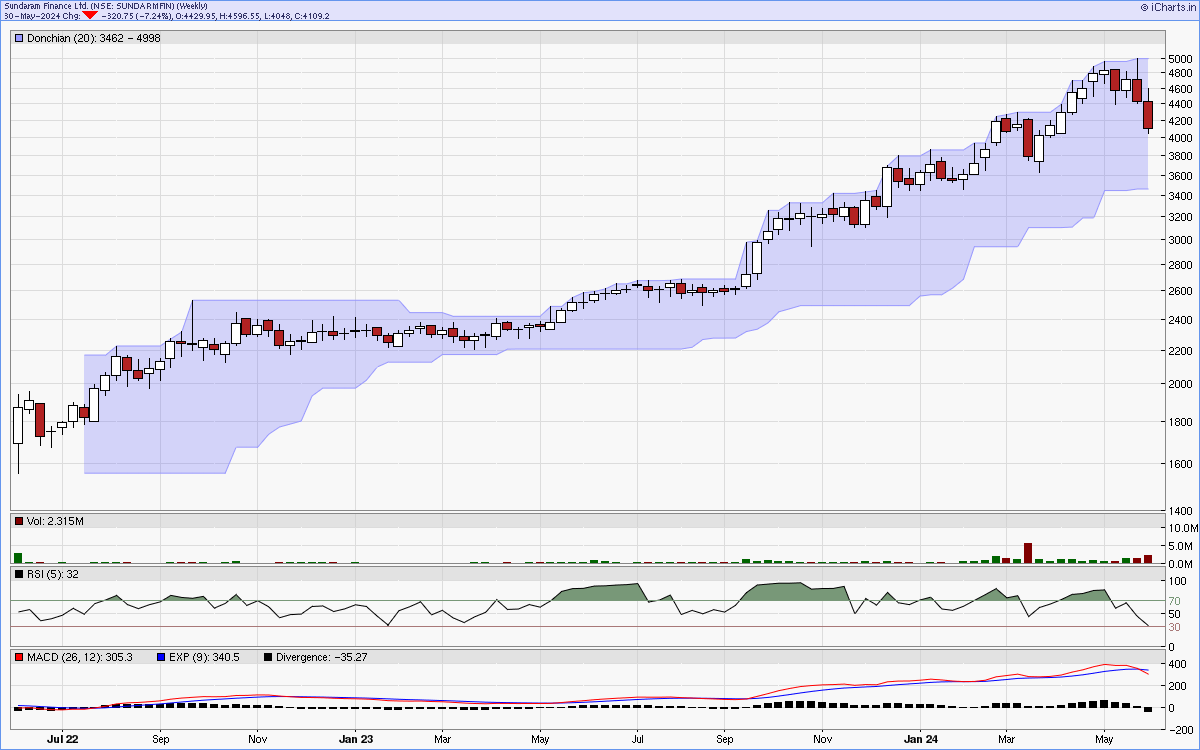
Charts courtsey: iCharts.in