Price / Percentage change:
| Open | High | Low | Close |
| Latest | 334.65 | 346.65 | 334.00 | 344.80 |
| Prev day | 333.80 | 334.50 | 330.60 | 333.00 |
| Last week | 324.75 | 335.95 | 319.35 | 333.60 |
| Last month | 280.95 | 322.45 | 279.15 | 320.80 |
| All time | | 346.65 | 4.95 | |
| 1 Day | 5 Day | 20 Day | 50 Day |
| 3.50% | 3.00% | 21.50% | 31.00% |
Trading range:
| TradingRange | Highest
Close | Lowest
Close | Highest
High | Lowest
Low |
| 5 days | 344.80 | 329.05 | 346.65 | 326.45 |
| 10 days | 344.80 | 321.80 | 346.65 | 319.35 |
| 20 days | 344.80 | 283.00 | 346.65 | 281.80 |
Trend analysis :
| Trend | First Signal | Price | Reversal | P SAR |
| BBB | 05-04-2023 | 211.30 | 281.80 | 329.00 |
| ATR (20d) | Williams R | RSI (5d) | RSI (14d) | Vol | Av Vol (20d) |
| 6.24 | 96 | 89 | 86 | 2624000 | 1219000
|
Fibonacci price projections:
| 0% | 61.8% | 100% | 161.8% | 261.8% |
| Up | 252.55 | 262.72 | 269.00 | 279.17 | 295.62 |
| Dn | 269.00 | 258.83 | 252.55 | 242.38 | 225.93 |
Intraday pivot levels:
| Sup 2 | Sup 1 | Pivot | Res 1 | Res 2 |
| 329.15 | 336.95 | 341.80 | 349.60 | 354.45 |
Weekly pivot levels:
| Sup 2 | Sup 1 | Pivot | Res 1 | Res 2 |
| 313.00 | 323.25 | 329.60 | 339.85 | 346.20 |
Monthly pivot levels:
| Sup 2 | Sup 1 | Pivot | Res 1 | Res 2 |
| 264.15 | 292.45 | 307.45 | 335.75 | 350.75 |
Moving averages (simple):
| 5 Day | 20 Day | 50 Day | 200 Day |
| 334 | 314 | 291 |
253 |
Other levels:
| 52 Week Hi - Lo | Last Mnth Hi - Lo | Swing Hi - Lo | B Band Hi - Lo |
| 346.65 - 198.85 | 322.45 - 279.15 | 269.00 - 252.55 | 352.71 - 274.68 |
|
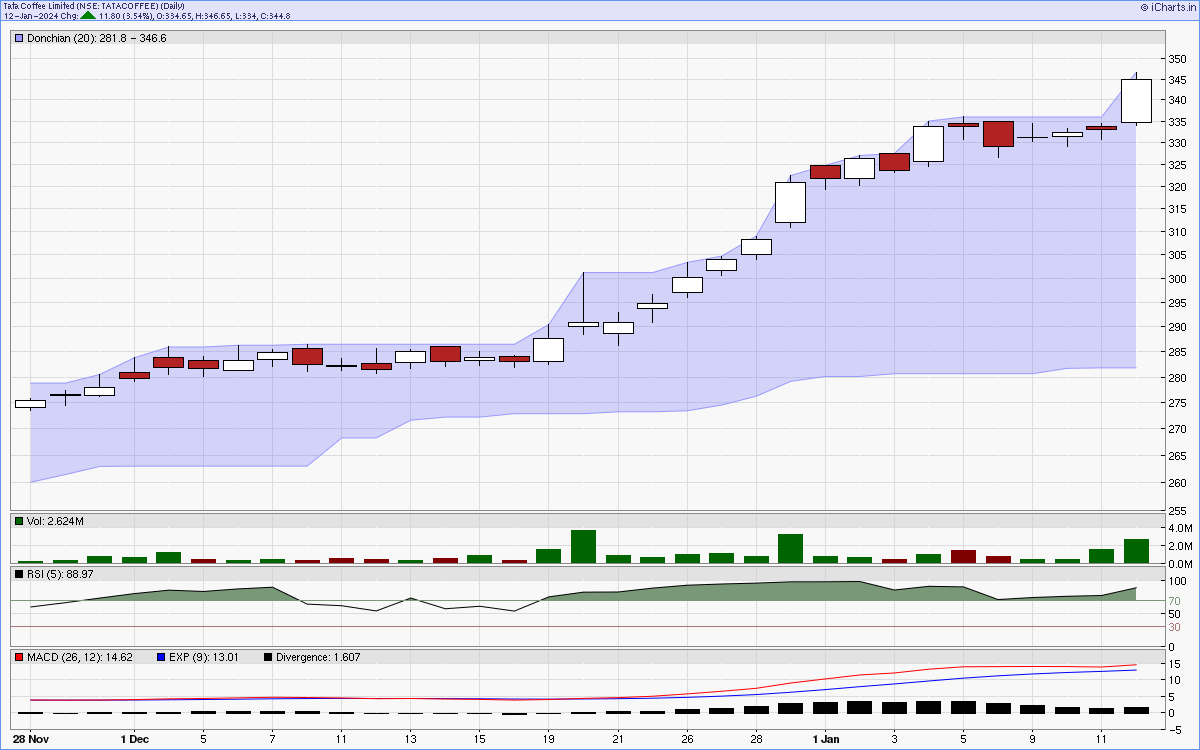
Charts...
Six months candlestick chart
Charts courtsey: iCharts.in
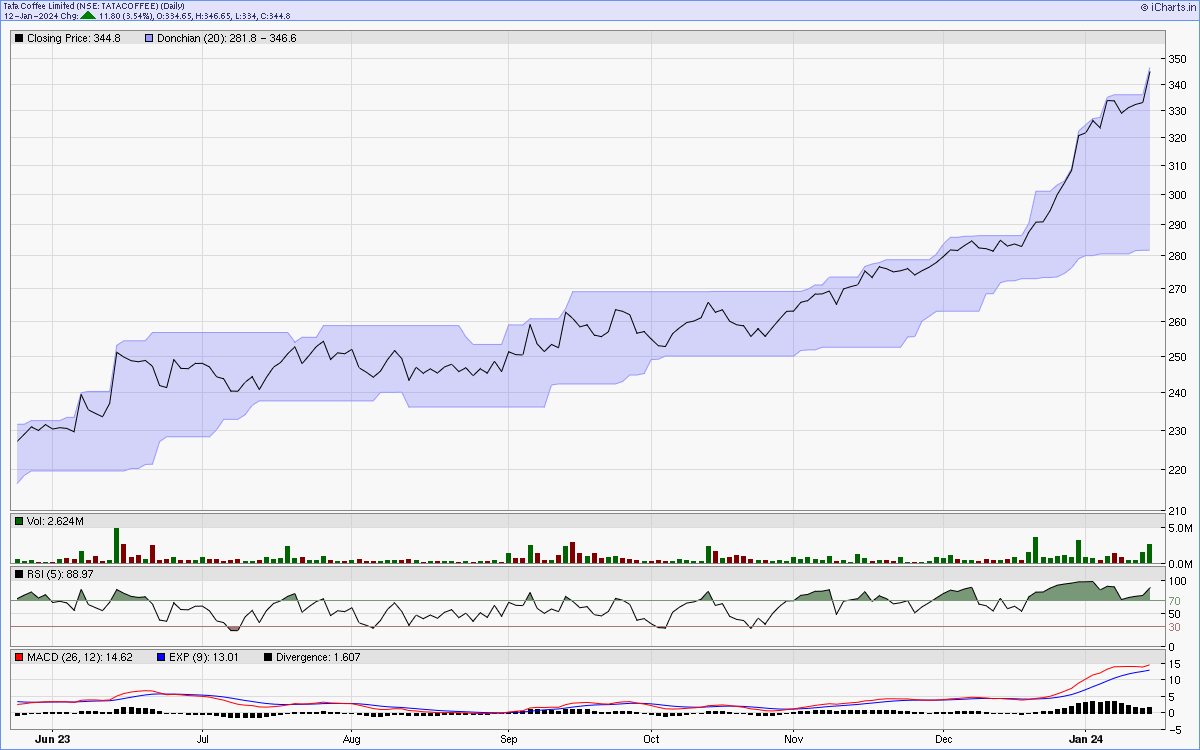
One year line chart
Two years weekly chart
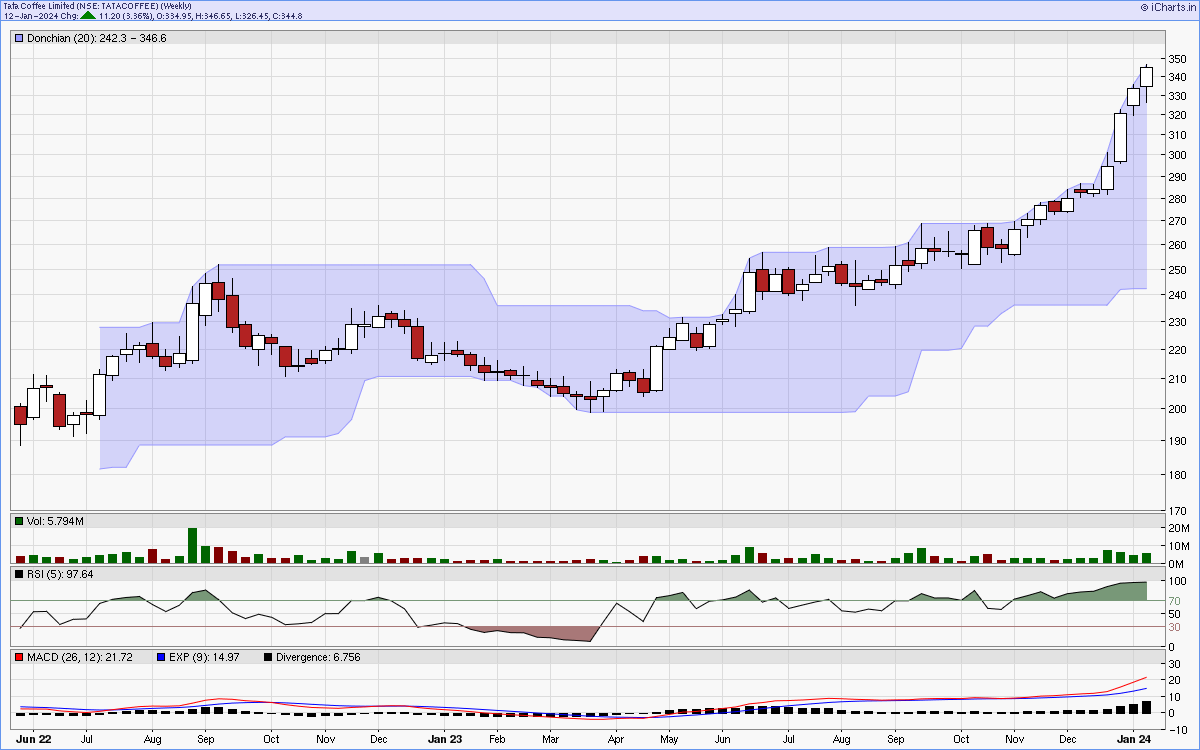
Charts courtsey: iCharts.in