Price / Percentage change:
| Open | High | Low | Close |
| Latest | 3125.00 | 3188.80 | 3003.55 | 3043.60 |
| Prev day | 3118.75 | 3219.85 | 3051.00 | 3096.30 |
| Last week | 2801.10 | 3214.95 | 2801.10 | 3192.05 |
| Last month | 2488.00 | 3250.00 | 2430.10 | 3072.65 |
| All time | | 3250.00 | 1645.00 | |
| 1 Day | 5 Day | 20 Day | 50 Day |
| -1.50% | -0.50% | 9.00% | 37.50% |
Trading range:
| TradingRange | Highest
Close | Lowest
Close | Highest
High | Lowest
Low |
| 5 days | 3192.05 | 3043.60 | 3250.00 | 3003.55 |
| 10 days | 3192.05 | 2849.05 | 3250.00 | 2731.60 |
| 20 days | 3192.05 | 2637.65 | 3250.00 | 2601.25 |
Trend analysis :
| Trend | First Signal | Price | Reversal | P SAR |
| BBB | | | 2601.25 | 3250.00 |
| ATR (20d) | Williams R | RSI (5d) | RSI (14d) | Vol | Av Vol (20d) |
| 172.33 | 65 | 52 | 61 | 22000 | 23000
|
Fibonacci price projections:
| 0% | 61.8% | 100% | 161.8% | 261.8% |
| Up | 2655.45 | 2855.90 | 2979.80 | 3180.25 | 3504.60 |
| Dn | 2979.80 | 2779.35 | 2655.45 | 2455.00 | 2130.65 |
Intraday pivot levels:
| Sup 2 | Sup 1 | Pivot | Res 1 | Res 2 |
| 2893.40 | 2968.50 | 3078.65 | 3153.75 | 3263.90 |
Weekly pivot levels:
| Sup 2 | Sup 1 | Pivot | Res 1 | Res 2 |
| 2655.50 | 2923.75 | 3069.35 | 3337.60 | 3483.20 |
Monthly pivot levels:
| Sup 2 | Sup 1 | Pivot | Res 1 | Res 2 |
| 2097.65 | 2585.10 | 2917.55 | 3405.00 | 3737.45 |
Moving averages (simple):
| 5 Day | 20 Day | 50 Day | 200 Day |
| 3109 | 2899 | 2582 |
|
Other levels:
| 52 Week Hi - Lo | Last Mnth Hi - Lo | Swing Hi - Lo | B Band Hi - Lo |
| 3250.00 - 1645.00 | 3250.00 - 2430.10 | 2979.80 - 2655.45 | 3220.94 - 2577.38 |
|
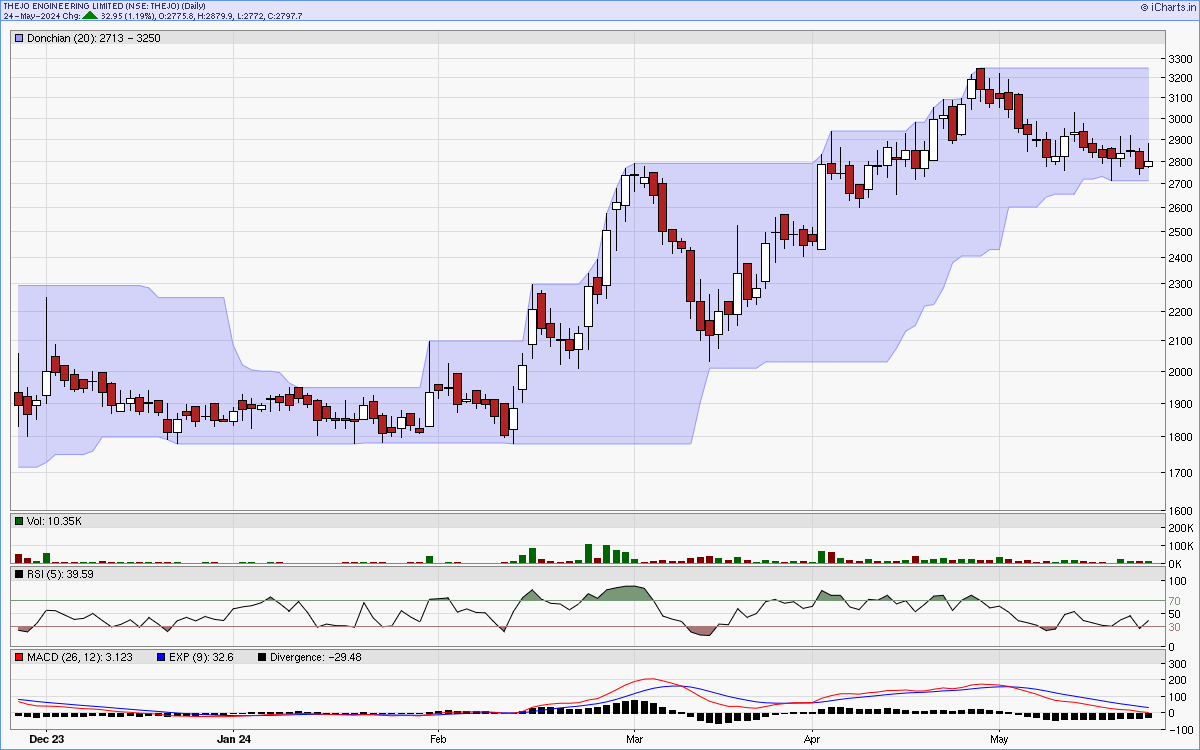
Charts...
Six months candlestick chart
Charts courtsey: iCharts.in
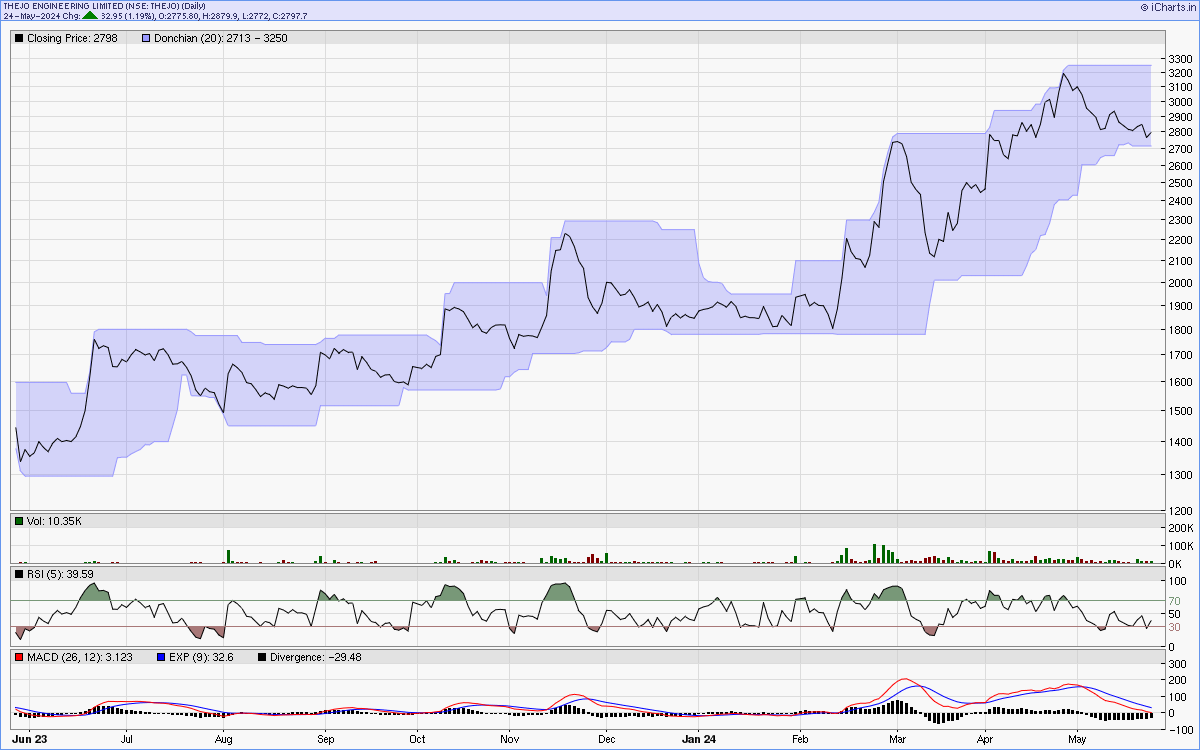
One year line chart
Two years weekly chart
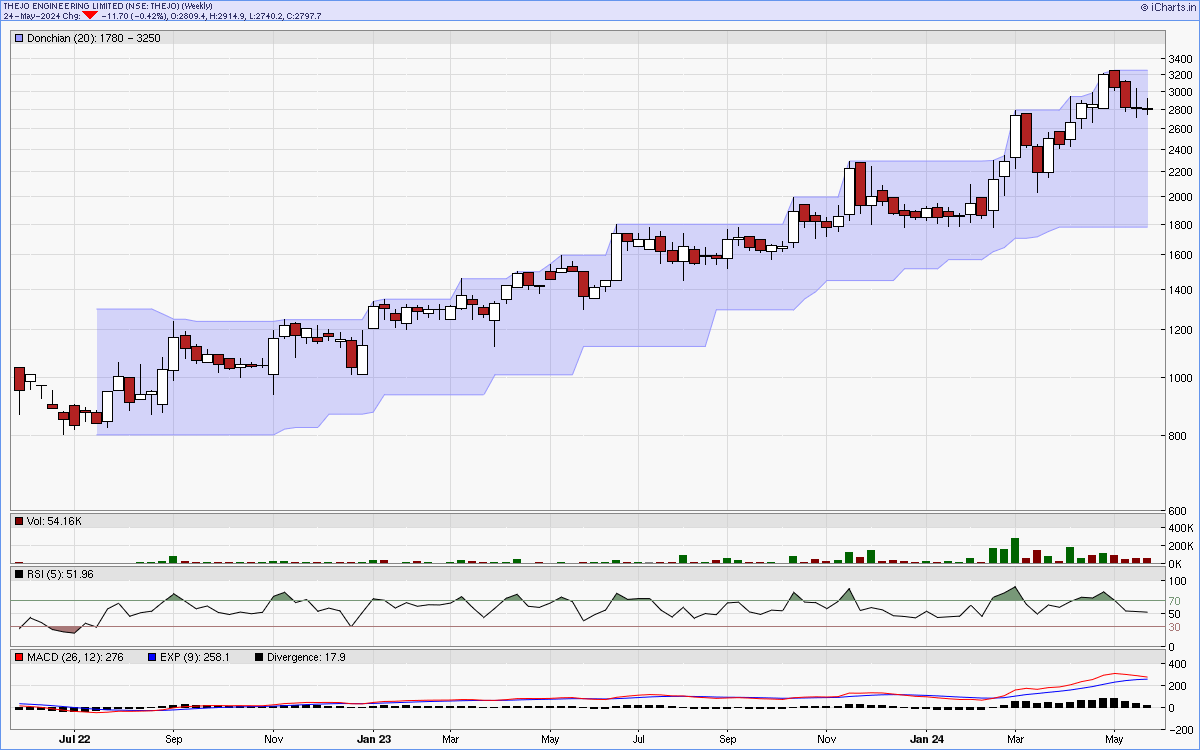
Charts courtsey: iCharts.in