Price / Percentage change:
| Open | High | Low | Close |
| Latest | 202.95 | 205.70 | 193.25 | 202.05 |
| Prev day | 205.35 | 208.40 | 202.75 | 204.65 |
| Last week | 205.20 | 210.95 | 201.80 | 204.65 |
| Last month | 168.80 | 222.50 | 165.20 | 203.75 |
| All time | | 222.50 | 21.95 | |
| 1 Day | 5 Day | 20 Day | 50 Day |
| -1.00% | -1.00% | 17.00% | 21.00% |
Trading range:
| TradingRange | Highest
Close | Lowest
Close | Highest
High | Lowest
Low |
| 5 days | 206.35 | 202.05 | 210.95 | 193.25 |
| 10 days | 215.20 | 200.45 | 222.50 | 193.25 |
| 20 days | 215.20 | 170.80 | 222.50 | 165.90 |
Trend analysis :
| Trend | First Signal | Price | Reversal | P SAR |
| BBB | 03-04-2024 | 172.20 | 165.90 | 220.81 |
| ATR (20d) | Williams R | RSI (5d) | RSI (14d) | Vol | Av Vol (20d) |
| 9.20 | 64 | 47 | 63 | 997000 | 1432000
|
Fibonacci price projections:
| 0% | 61.8% | 100% | 161.8% | 261.8% |
| Up | 166.05 | 200.94 | 222.50 | 257.39 | 313.84 |
| Dn | 222.50 | 187.61 | 166.05 | 131.16 | 74.71 |
Intraday pivot levels:
| Sup 2 | Sup 1 | Pivot | Res 1 | Res 2 |
| 187.85 | 194.90 | 200.30 | 207.35 | 212.75 |
Weekly pivot levels:
| Sup 2 | Sup 1 | Pivot | Res 1 | Res 2 |
| 196.65 | 200.65 | 205.80 | 209.80 | 214.95 |
Monthly pivot levels:
| Sup 2 | Sup 1 | Pivot | Res 1 | Res 2 |
| 139.85 | 171.80 | 197.15 | 229.10 | 254.45 |
Moving averages (simple):
| 5 Day | 20 Day | 50 Day | 200 Day |
| 204 | 193 | 173 |
143 |
Other levels:
| 52 Week Hi - Lo | Last Mnth Hi - Lo | Swing Hi - Lo | B Band Hi - Lo |
| 222.50 - 59.40 | 222.50 - 165.20 | 222.50 - 166.05 | 223.42 - 163.10 |
|
Charts...
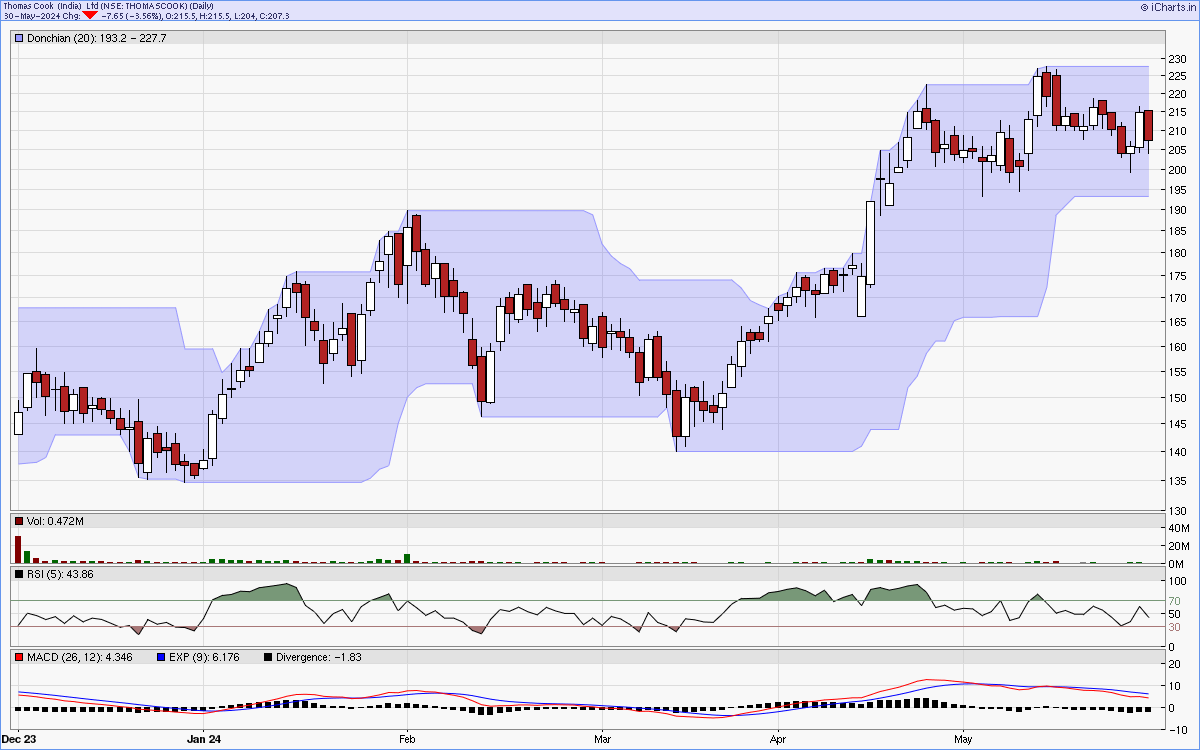
Six months candlestick chart
Charts courtsey: iCharts.in
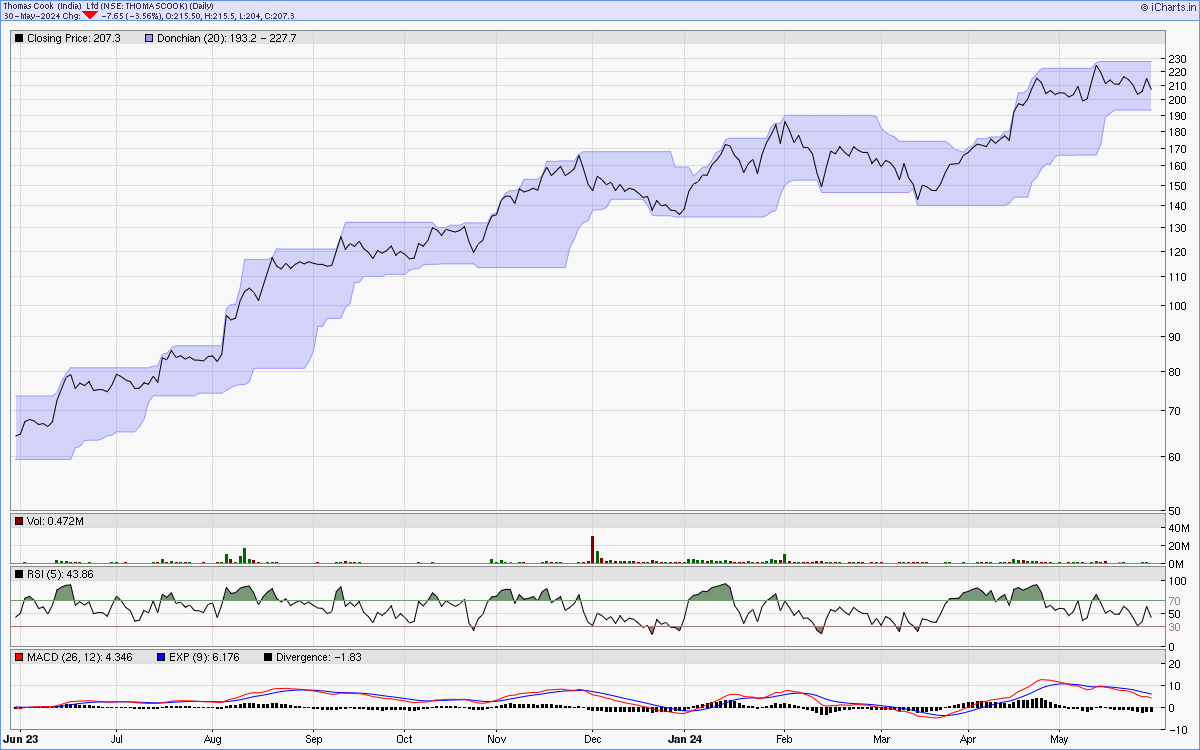
One year line chart
Two years weekly chart
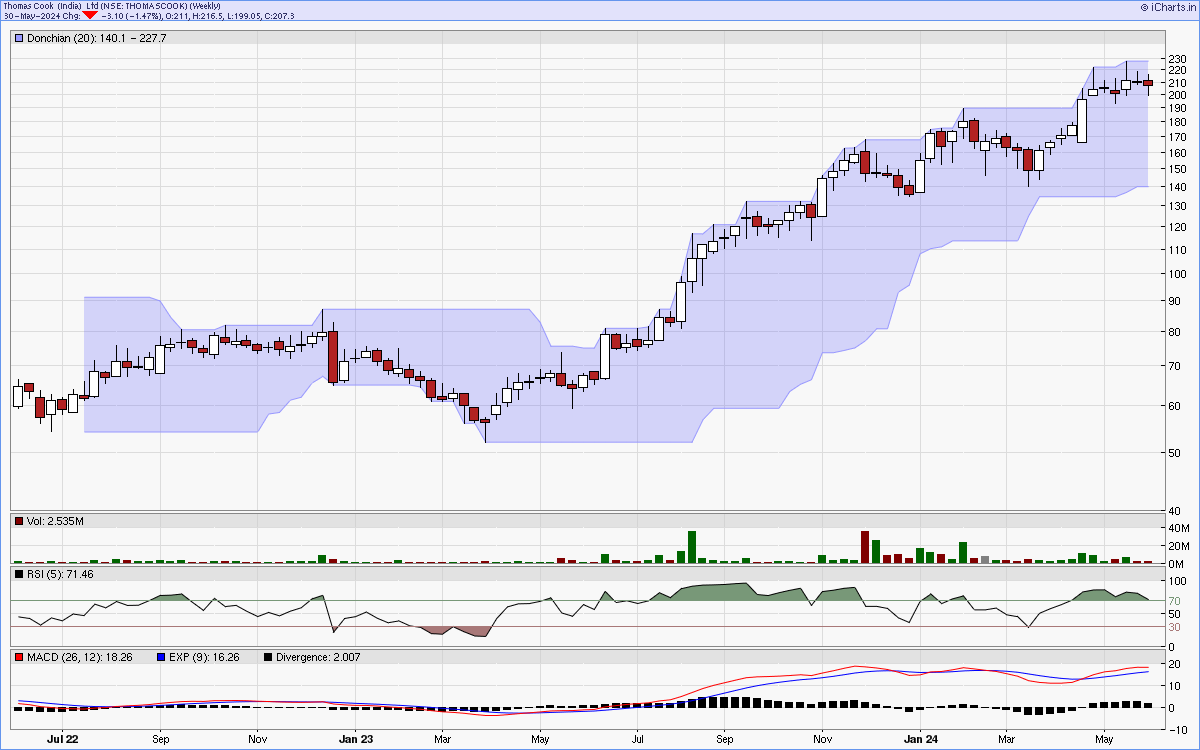
Charts courtsey: iCharts.in