Price / Percentage change:
| Open | High | Low | Close |
| Latest | 277.50 | 290.40 | 273.20 | 282.10 |
| Prev day | 279.70 | 280.85 | 272.75 | 274.80 |
| Last week | 274.85 | 283.95 | 265.80 | 274.80 |
| Last month | 252.80 | 283.00 | 248.30 | 276.05 |
| All time | | 290.40 | 17.55 | |
| 1 Day | 5 Day | 20 Day | 50 Day |
| 2.50% | 3.00% | 5.00% | 30.50% |
Trading range:
| TradingRange | Highest
Close | Lowest
Close | Highest
High | Lowest
Low |
| 5 days | 282.10 | 268.50 | 290.40 | 265.80 |
| 10 days | 282.10 | 266.50 | 290.40 | 264.30 |
| 20 days | 282.10 | 260.05 | 290.40 | 252.00 |
Trend analysis :
| Trend | First Signal | Price | Reversal | P SAR |
| BBB | 13-02-2024 | 199.05 | 252.00 | 257.25 |
| ATR (20d) | Williams R | RSI (5d) | RSI (14d) | Vol | Av Vol (20d) |
| 12.57 | 78 | 69 | 64 | 1702000 | 1409000
|
Fibonacci price projections:
| 0% | 61.8% | 100% | 161.8% | 261.8% |
| Up | 252.00 | 268.62 | 278.90 | 295.52 | 322.42 |
| Dn | 278.90 | 262.28 | 252.00 | 235.38 | 208.48 |
Intraday pivot levels:
| Sup 2 | Sup 1 | Pivot | Res 1 | Res 2 |
| 264.70 | 273.40 | 281.90 | 290.55 | 299.05 |
Weekly pivot levels:
| Sup 2 | Sup 1 | Pivot | Res 1 | Res 2 |
| 256.65 | 265.65 | 274.80 | 283.80 | 292.95 |
Monthly pivot levels:
| Sup 2 | Sup 1 | Pivot | Res 1 | Res 2 |
| 234.40 | 255.20 | 269.10 | 289.90 | 303.80 |
Moving averages (simple):
| 5 Day | 20 Day | 50 Day | 200 Day |
| 276 | 270 | 241 |
181 |
Other levels:
| 52 Week Hi - Lo | Last Mnth Hi - Lo | Swing Hi - Lo | B Band Hi - Lo |
| 290.40 - 80.20 | 283.00 - 248.30 | 278.90 - 252.00 | 283.20 - 257.34 |
|
Charts...
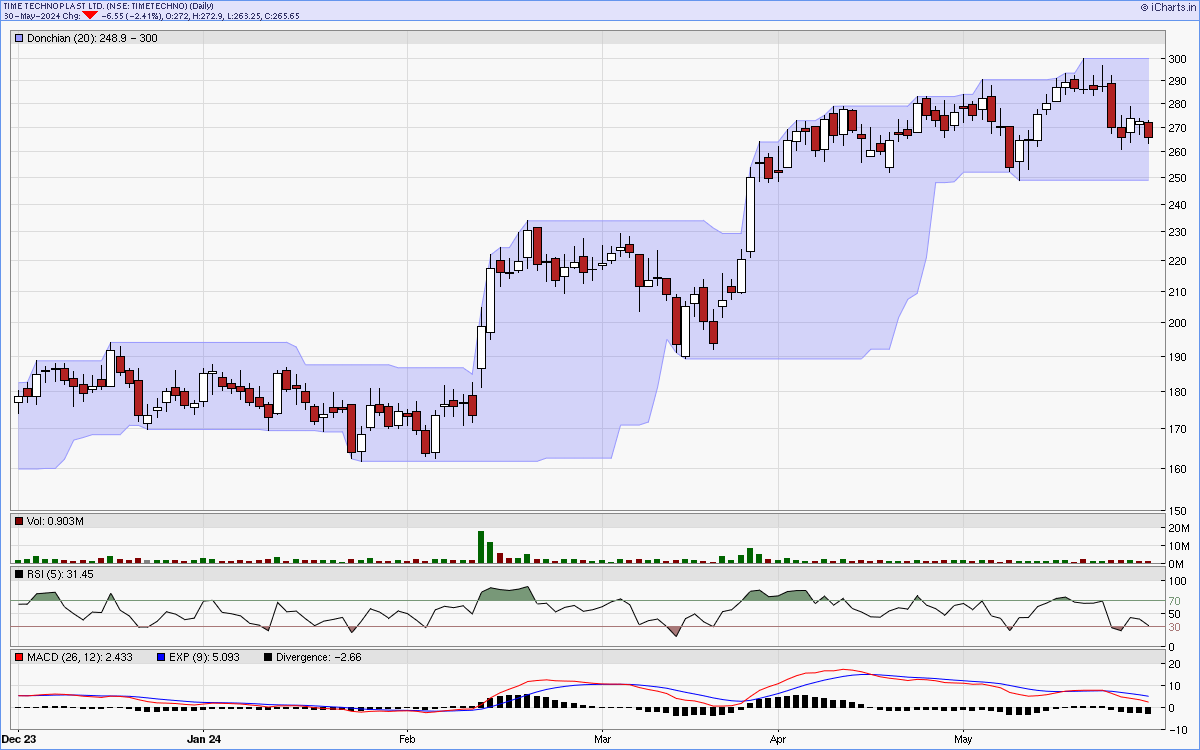
Six months candlestick chart
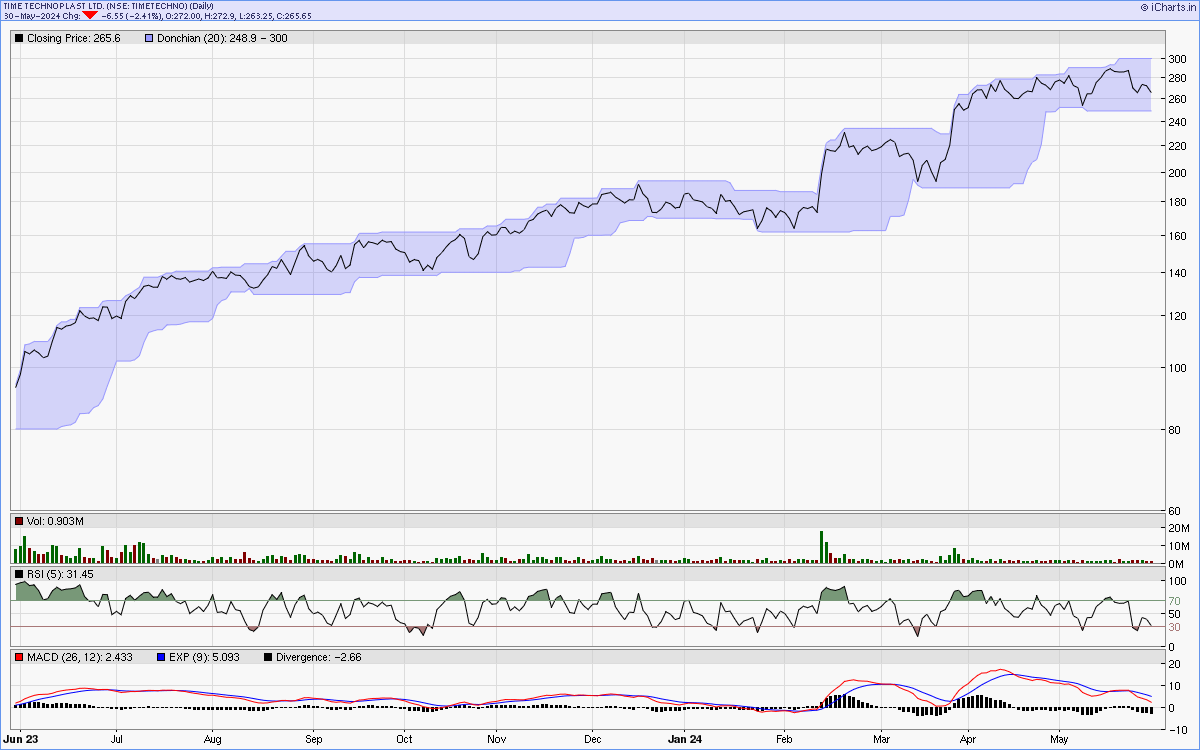
Charts courtsey: iCharts.in
One year line chart
Two years weekly chart
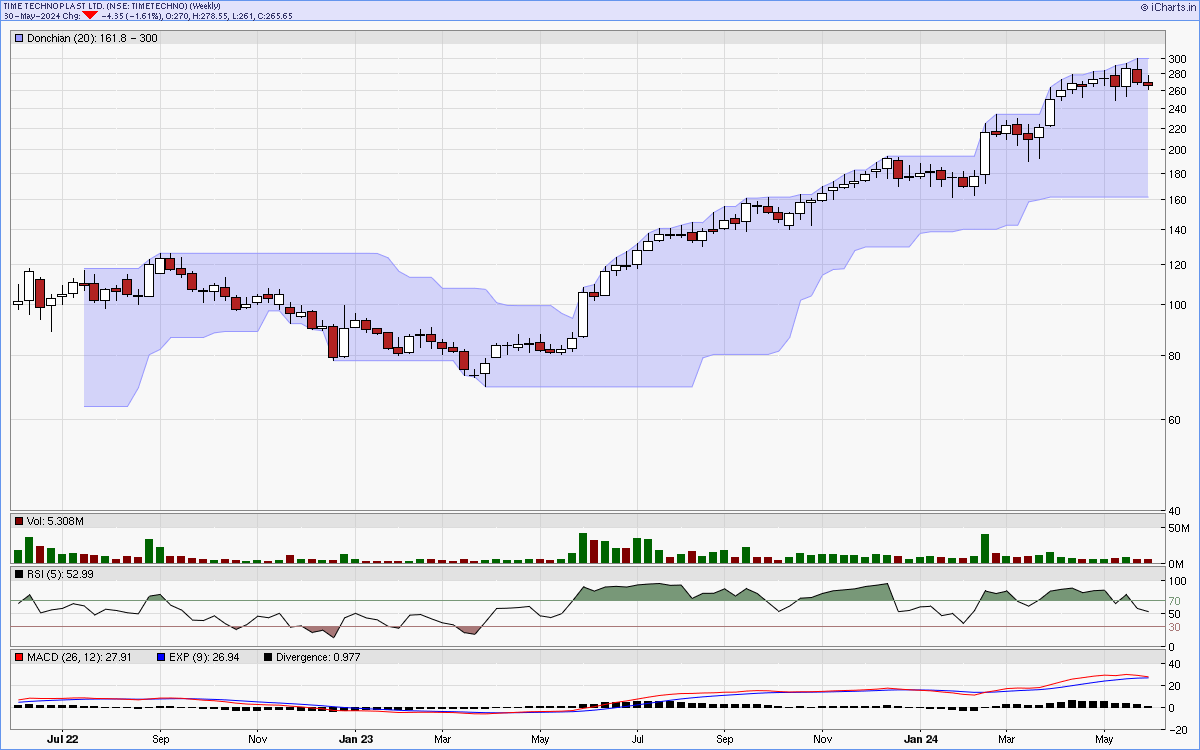
Charts courtsey: iCharts.in