Price / Percentage change:
| Open | High | Low | Close |
| Latest | 363.50 | 367.25 | 353.95 | 355.95 |
| Prev day | 364.00 | 367.95 | 359.05 | 363.45 |
| Last week | 335.00 | 368.40 | 329.50 | 364.10 |
| Last month | 312.55 | 380.40 | 312.55 | 362.35 |
| All time | | 416.50 | 14.55 | |
| 1 Day | 5 Day | 20 Day | 50 Day |
| -2.00% | -1.50% | 6.50% | 5.50% |
Trading range:
| TradingRange | Highest
Close | Lowest
Close | Highest
High | Lowest
Low |
| 5 days | 371.10 | 355.95 | 380.40 | 353.95 |
| 10 days | 371.10 | 324.95 | 380.40 | 322.05 |
| 20 days | 371.10 | 324.05 | 380.40 | 318.05 |
Trend analysis :
| Trend | First Signal | Price | Reversal | P SAR |
| BBB | 22-04-2024 | 359.90 | 318.05 | 350.19 |
| ATR (20d) | Williams R | RSI (5d) | RSI (14d) | Vol | Av Vol (20d) |
| 11.87 | 61 | 48 | 57 | 432000 | 1029000
|
Fibonacci price projections:
| 0% | 61.8% | 100% | 161.8% | 261.8% |
| Up | 318.05 | 356.58 | 380.40 | 418.93 | 481.28 |
| Dn | 380.40 | 341.87 | 318.05 | 279.52 | 217.17 |
Intraday pivot levels:
| Sup 2 | Sup 1 | Pivot | Res 1 | Res 2 |
| 345.75 | 350.85 | 359.05 | 364.15 | 372.35 |
Weekly pivot levels:
| Sup 2 | Sup 1 | Pivot | Res 1 | Res 2 |
| 315.10 | 339.60 | 354.00 | 378.50 | 392.90 |
Monthly pivot levels:
| Sup 2 | Sup 1 | Pivot | Res 1 | Res 2 |
| 283.90 | 323.10 | 351.75 | 390.95 | 419.60 |
Moving averages (simple):
| 5 Day | 20 Day | 50 Day | 200 Day |
| 363 | 345 | 337 |
341 |
Other levels:
| 52 Week Hi - Lo | Last Mnth Hi - Lo | Swing Hi - Lo | B Band Hi - Lo |
| 416.50 - 261.10 | 380.40 - 312.55 | 380.40 - 318.05 | 375.67 - 314.27 |
|
Charts...
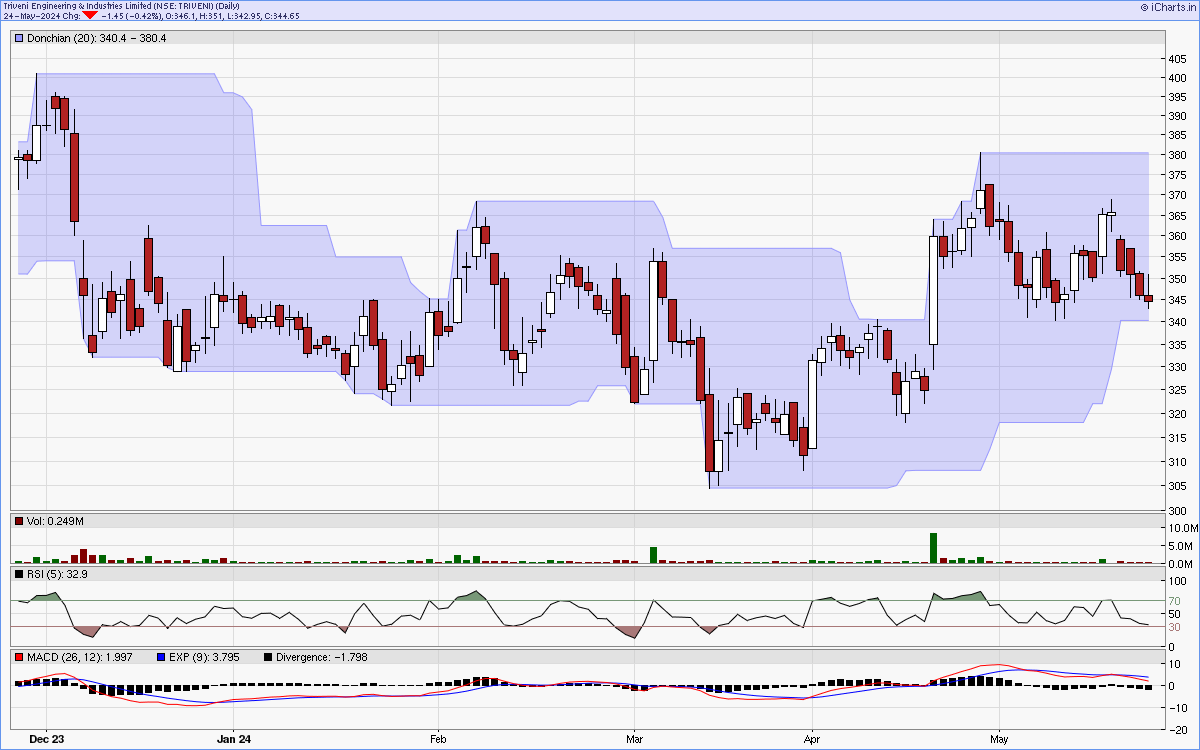
Six months candlestick chart
Charts courtsey: iCharts.in
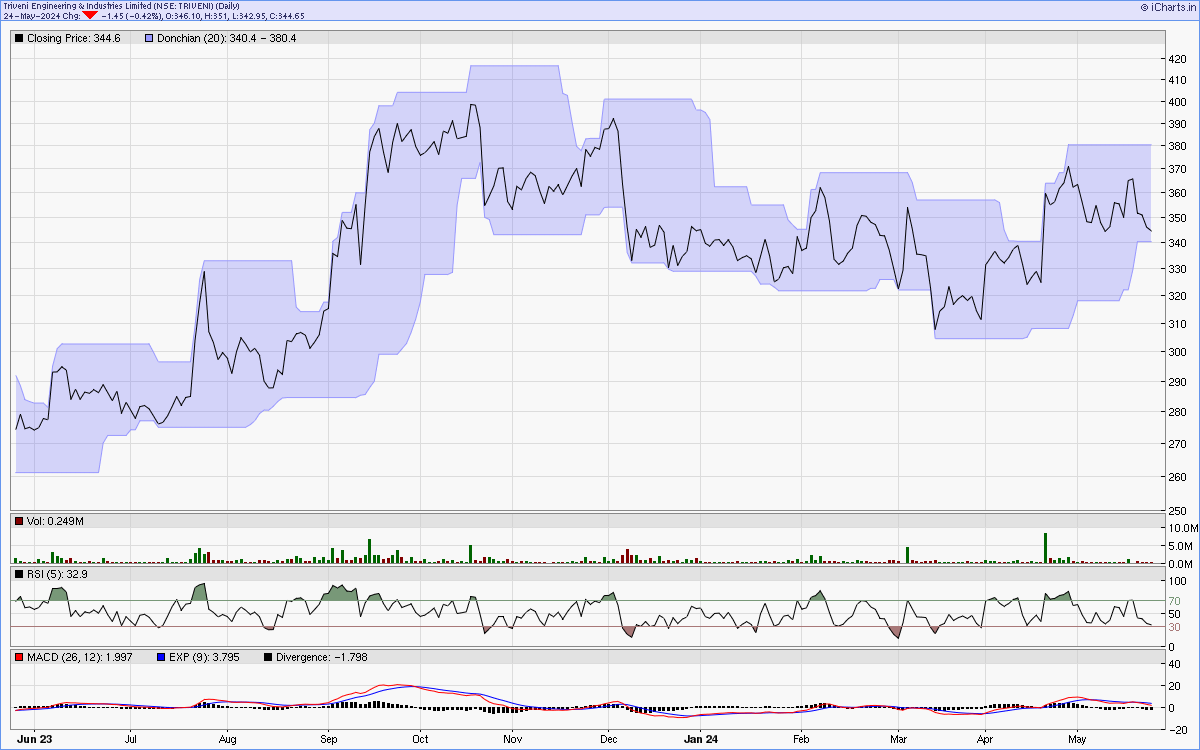
One year line chart
Two years weekly chart
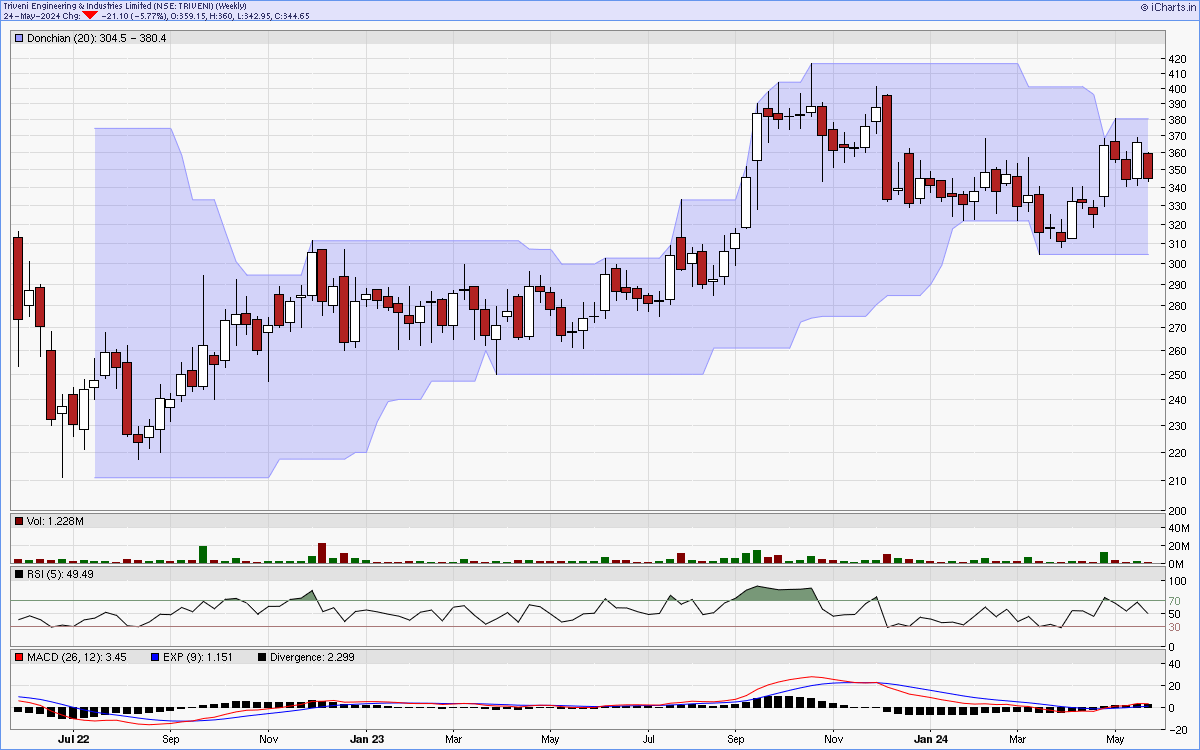
Charts courtsey: iCharts.in