Price / Percentage change:
| Open | High | Low | Close |
| Latest | 2046.40 | 2046.40 | 1961.00 | 1984.70 |
| Prev day | 2065.00 | 2070.55 | 1992.30 | 2039.10 |
| Last week | 2057.15 | 2074.00 | 1992.30 | 2039.10 |
| Last month | 1760.00 | 2106.00 | 1736.00 | 2037.90 |
| All time | | 2106.00 | 63.05 | |
| 1 Day | 5 Day | 20 Day | 50 Day |
| -2.50% | -2.50% | 10.00% | 14.00% |
Trading range:
| TradingRange | Highest
Close | Lowest
Close | Highest
High | Lowest
Low |
| 5 days | 2053.70 | 1984.70 | 2074.00 | 1961.00 |
| 10 days | 2053.70 | 1853.85 | 2106.00 | 1835.80 |
| 20 days | 2053.70 | 1781.00 | 2106.00 | 1769.00 |
Trend analysis :
| Trend | First Signal | Price | Reversal | P SAR |
| BBB | 01-04-2024 | 1779.55 | 1769.00 | 2103.73 |
| ATR (20d) | Williams R | RSI (5d) | RSI (14d) | Vol | Av Vol (20d) |
| 55.11 | 59 | 45 | 63 | 500000 | 512000
|
Fibonacci price projections:
| 0% | 61.8% | 100% | 161.8% | 261.8% |
| Up | 1647.25 | 1797.27 | 1890.00 | 2040.02 | 2282.77 |
| Dn | 1890.00 | 1739.98 | 1647.25 | 1497.23 | 1254.48 |
Intraday pivot levels:
| Sup 2 | Sup 1 | Pivot | Res 1 | Res 2 |
| 1911.95 | 1948.25 | 1997.35 | 2033.70 | 2082.75 |
Weekly pivot levels:
| Sup 2 | Sup 1 | Pivot | Res 1 | Res 2 |
| 1953.40 | 1996.20 | 2035.10 | 2077.85 | 2116.80 |
Monthly pivot levels:
| Sup 2 | Sup 1 | Pivot | Res 1 | Res 2 |
| 1589.95 | 1813.90 | 1959.95 | 2183.90 | 2329.95 |
Moving averages (simple):
| 5 Day | 20 Day | 50 Day | 200 Day |
| 2031 | 1914 | 1798 |
1681 |
Other levels:
| 52 Week Hi - Lo | Last Mnth Hi - Lo | Swing Hi - Lo | B Band Hi - Lo |
| 2106.00 - 1393.60 | 2106.00 - 1736.00 | 1890.00 - 1647.25 | 2110.36 - 1718.01 |
|
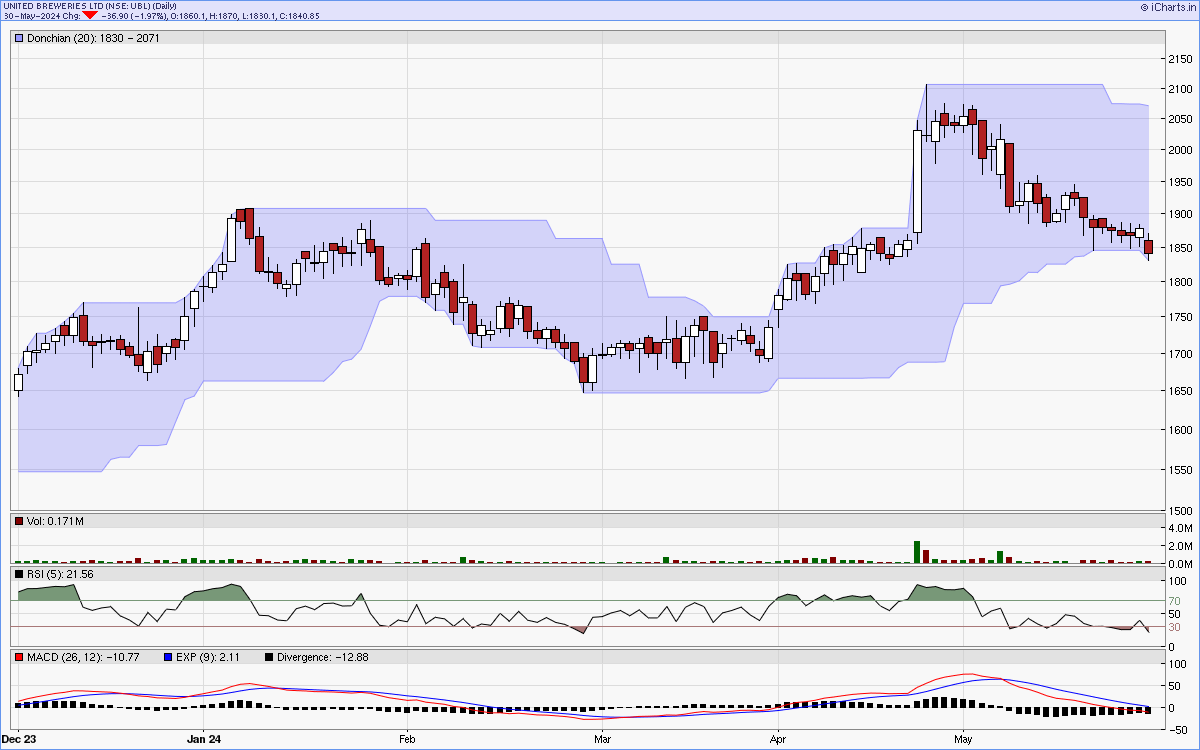
Charts...
Six months candlestick chart
Charts courtsey: iCharts.in
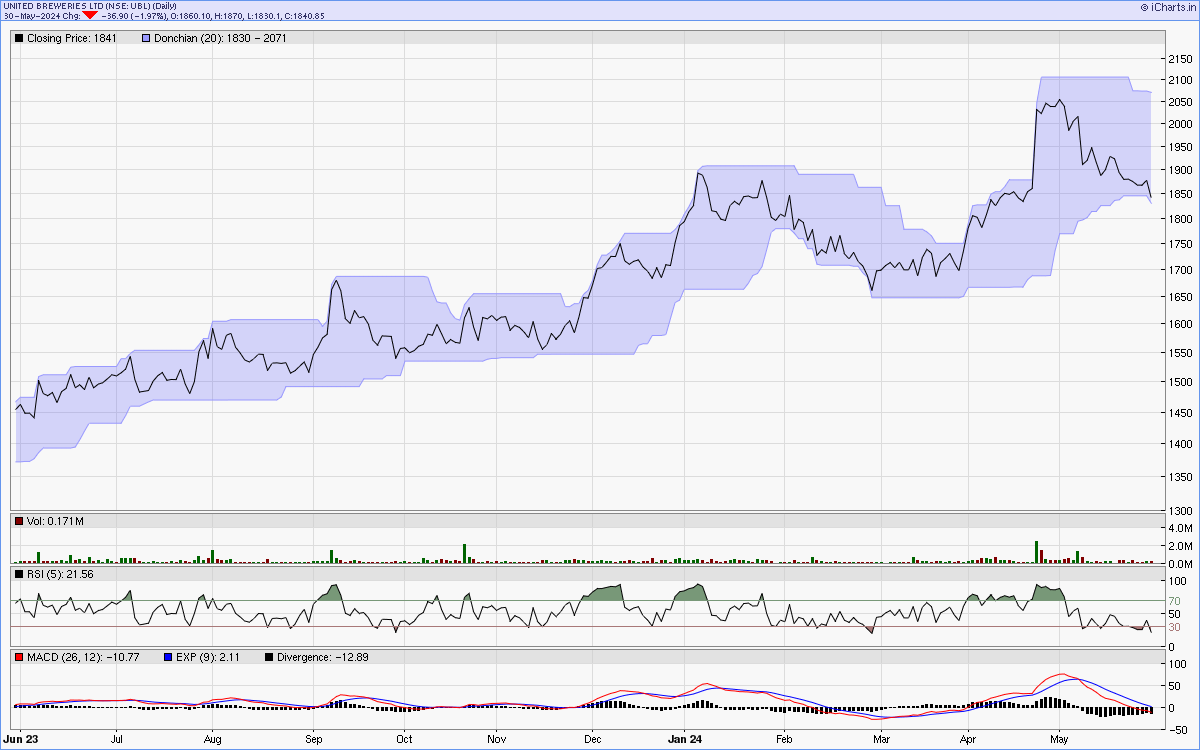
One year line chart
Two years weekly chart
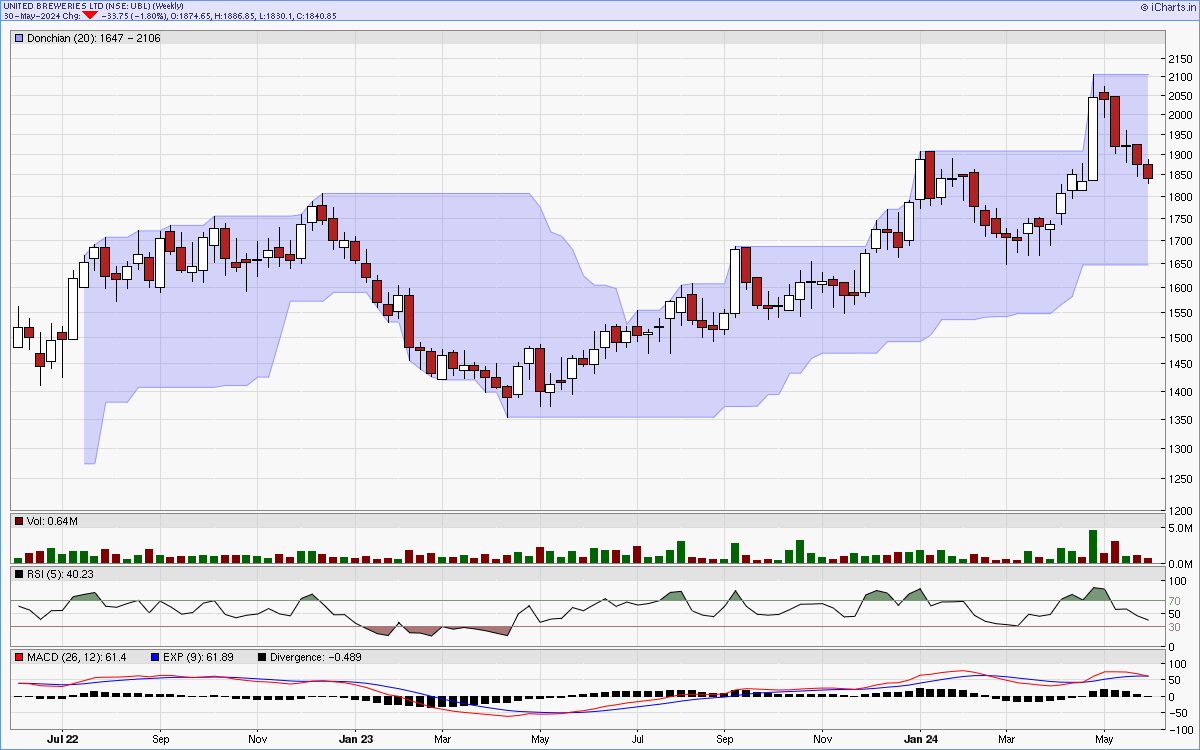
Charts courtsey: iCharts.in