Price / Percentage change:
| Open | High | Low | Close |
| Latest | 155.00 | 155.70 | 153.80 | 154.65 |
| Prev day | 157.00 | 157.00 | 153.25 | 154.20 |
| Last week | 142.70 | 153.30 | 142.70 | 150.90 |
| Last month | 154.50 | 163.20 | 138.10 | 154.20 |
| All time | | 426.95 | 14.60 | |
| 1 Day | 5 Day | 20 Day | 50 Day |
| 0.00% | 5.00% | -1.00% | 11.00% |
Trading range:
| TradingRange | Highest
Close | Lowest
Close | Highest
High | Lowest
Low |
| 5 days | 156.75 | 150.00 | 157.00 | 146.75 |
| 10 days | 156.75 | 140.70 | 157.00 | 138.10 |
| 20 days | 160.20 | 140.70 | 163.20 | 138.10 |
Trend analysis :
| Trend | First Signal | Price | Reversal | P SAR |
| SSS | 19-04-2024 | 140.70 | 163.20 | 139.86 |
| ATR (20d) | Williams R | RSI (5d) | RSI (14d) | Vol | Av Vol (20d) |
| 5.12 | 88 | 65 | 56 | 8371000 | 15730000
|
Fibonacci price projections:
| 0% | 61.8% | 100% | 161.8% | 261.8% |
| Up | 138.10 | 153.61 | 163.20 | 178.71 | 203.81 |
| Dn | 163.20 | 147.69 | 138.10 | 122.59 | 97.49 |
Intraday pivot levels:
| Sup 2 | Sup 1 | Pivot | Res 1 | Res 2 |
| 152.80 | 153.70 | 154.70 | 155.55 | 156.55 |
Weekly pivot levels:
| Sup 2 | Sup 1 | Pivot | Res 1 | Res 2 |
| 138.30 | 144.55 | 148.95 | 155.20 | 159.55 |
Monthly pivot levels:
| Sup 2 | Sup 1 | Pivot | Res 1 | Res 2 |
| 126.70 | 140.40 | 151.80 | 165.50 | 176.90 |
Moving averages (simple):
| 5 Day | 20 Day | 50 Day | 200 Day |
| 153 | 151 | 149 |
118 |
Other levels:
| 52 Week Hi - Lo | Last Mnth Hi - Lo | Swing Hi - Lo | B Band Hi - Lo |
| 163.20 - 68.00 | 163.20 - 138.10 | 163.20 - 138.10 | 162.15 - 140.15 |
|
Charts...
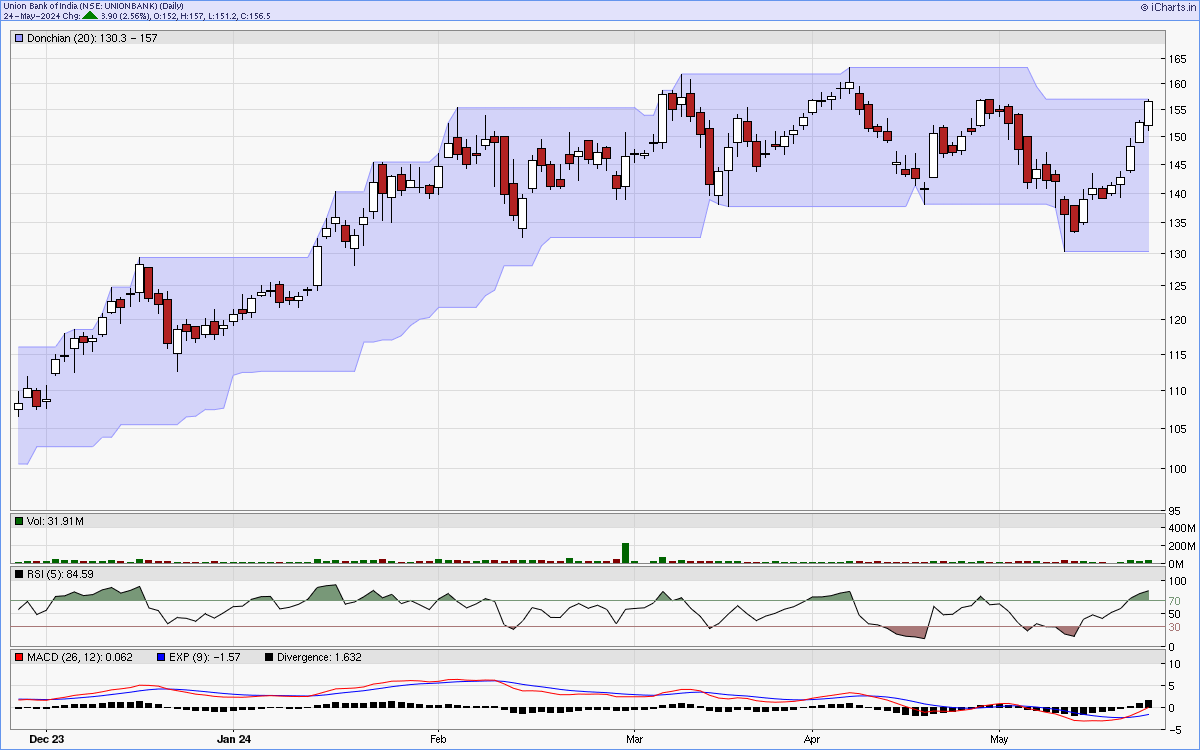
Six months candlestick chart
Charts courtsey: iCharts.in
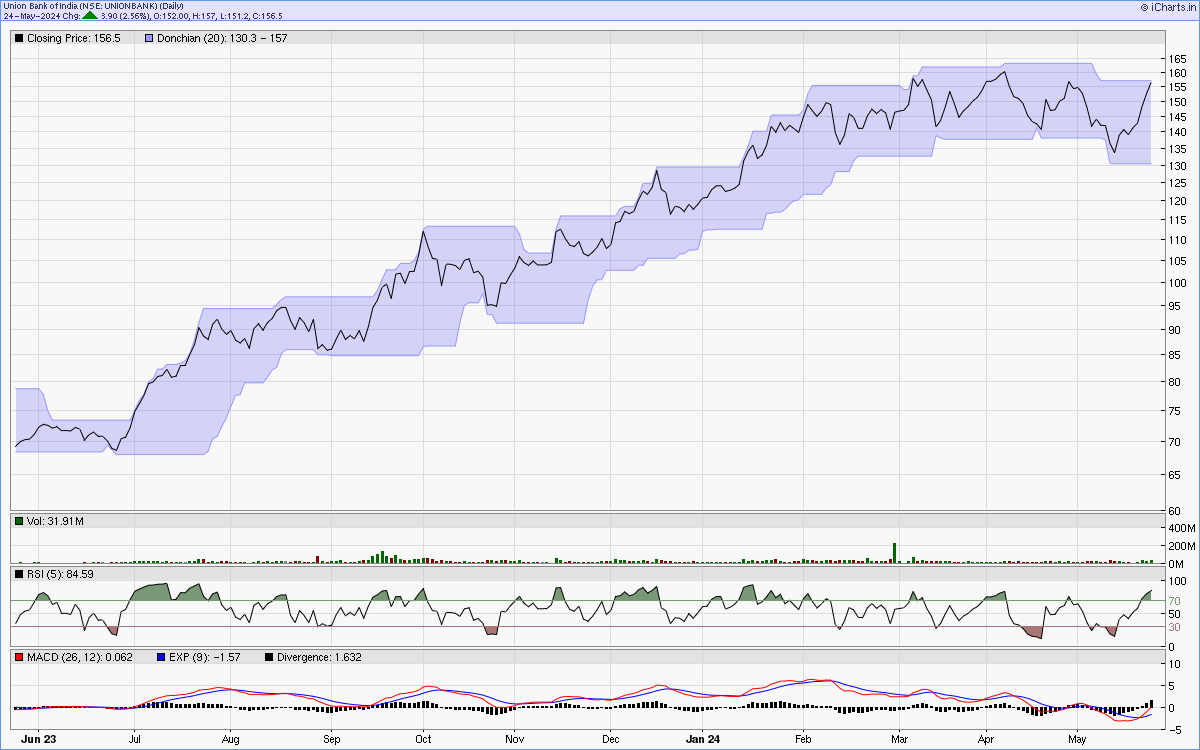
One year line chart
Two years weekly chart
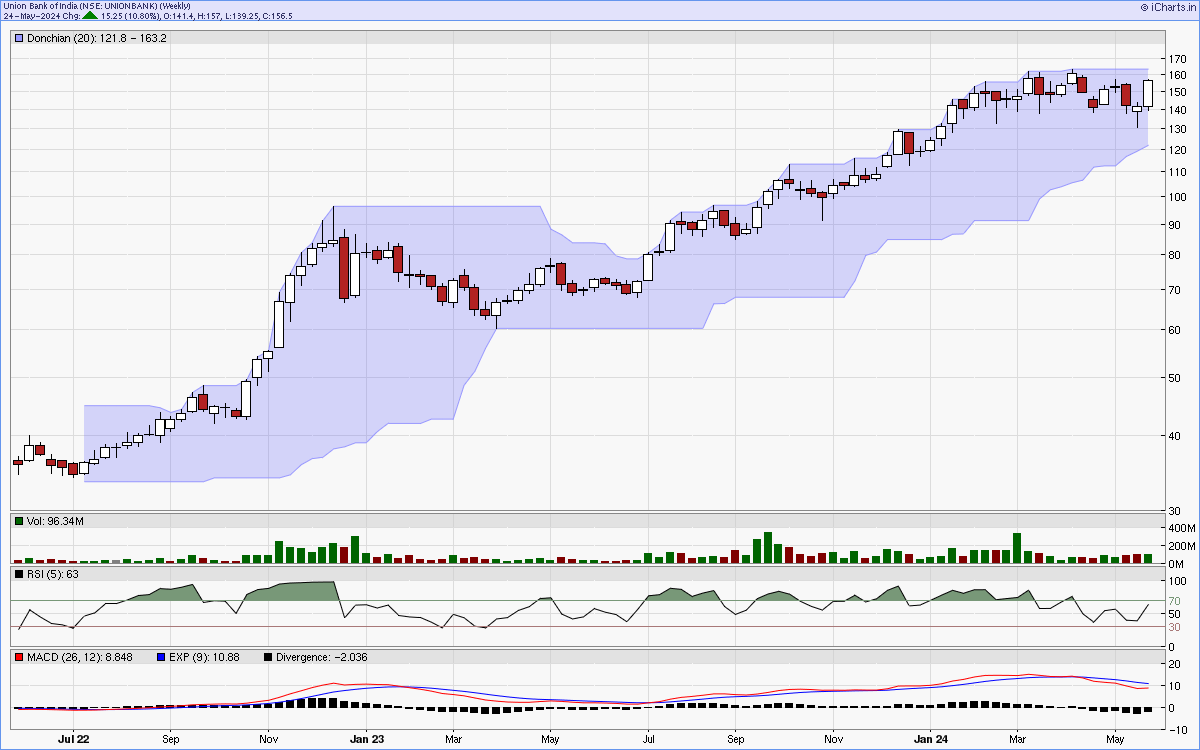
Charts courtsey: iCharts.in