Price / Percentage change:
| Open | High | Low | Close |
| Latest | 2132.85 | 2160.00 | 2086.60 | 2106.60 |
| Prev day | 2084.90 | 2148.95 | 2082.65 | 2132.80 |
| Last week | 2037.70 | 2189.90 | 2001.75 | 2078.85 |
| Last month | 1892.05 | 2189.90 | 1820.00 | 2082.60 |
| All time | | 2189.90 | 321.10 | |
| 1 Day | 5 Day | 20 Day | 50 Day |
| -1.00% | -0.50% | 14.50% | 35.00% |
Trading range:
| TradingRange | Highest
Close | Lowest
Close | Highest
High | Lowest
Low |
| 5 days | 2132.80 | 2078.85 | 2160.00 | 2064.00 |
| 10 days | 2132.80 | 1951.85 | 2189.90 | 1888.00 |
| 20 days | 2132.80 | 1920.35 | 2189.90 | 1840.20 |
Trend analysis :
| Trend | First Signal | Price | Reversal | P SAR |
| BBB | 30-01-2024 | 1490.55 | 1840.20 | 1910.93 |
| ATR (20d) | Williams R | RSI (5d) | RSI (14d) | Vol | Av Vol (20d) |
| 83.17 | 75 | 60 | 64 | 81000 | 126000
|
Fibonacci price projections:
| 0% | 61.8% | 100% | 161.8% | 261.8% |
| Up | 1862.00 | 1977.57 | 2049.00 | 2164.57 | 2351.57 |
| Dn | 2049.00 | 1933.43 | 1862.00 | 1746.43 | 1559.43 |
Intraday pivot levels:
| Sup 2 | Sup 1 | Pivot | Res 1 | Res 2 |
| 2044.25 | 2075.35 | 2117.70 | 2148.75 | 2191.10 |
Weekly pivot levels:
| Sup 2 | Sup 1 | Pivot | Res 1 | Res 2 |
| 1902.00 | 1990.40 | 2090.15 | 2178.55 | 2278.30 |
Monthly pivot levels:
| Sup 2 | Sup 1 | Pivot | Res 1 | Res 2 |
| 1660.90 | 1871.70 | 2030.80 | 2241.60 | 2400.70 |
Moving averages (simple):
| 5 Day | 20 Day | 50 Day | 200 Day |
| 2100 | 2019 | 1852 |
1496 |
Other levels:
| 52 Week Hi - Lo | Last Mnth Hi - Lo | Swing Hi - Lo | B Band Hi - Lo |
| 2189.90 - 867.00 | 2189.90 - 1820.00 | 2049.00 - 1862.00 | 2178.06 - 1860.39 |
|
Charts...
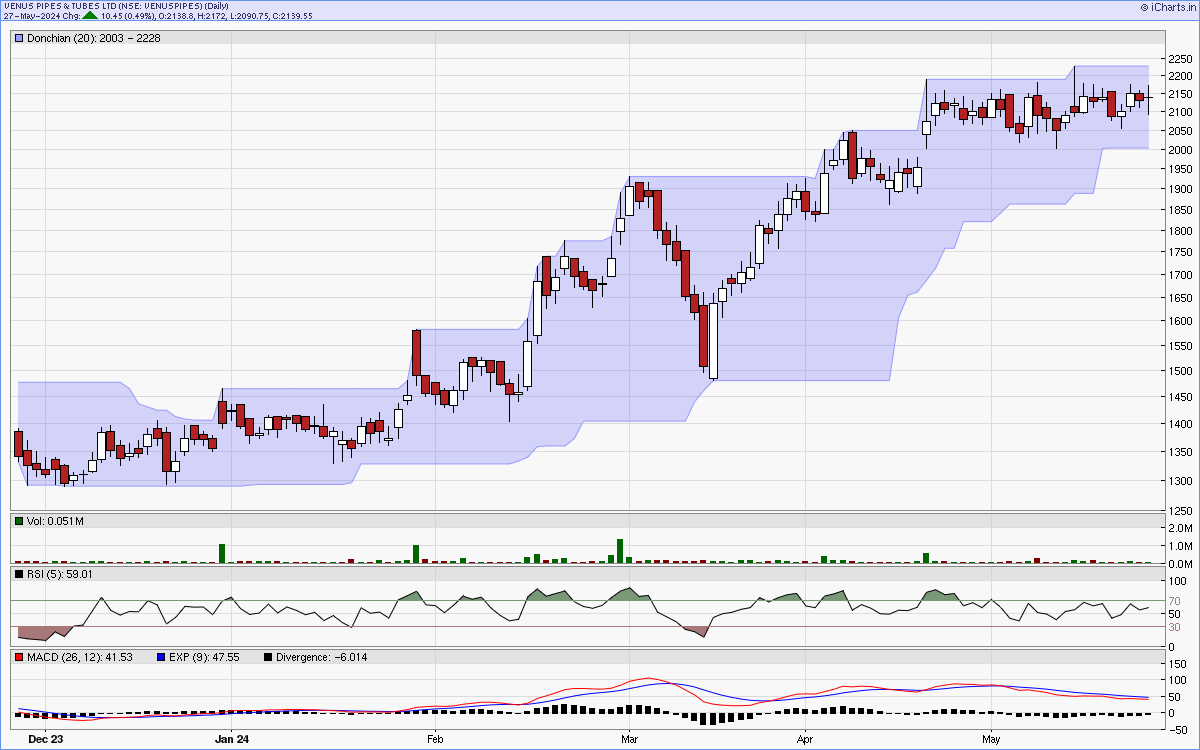
Six months candlestick chart
Charts courtsey: iCharts.in
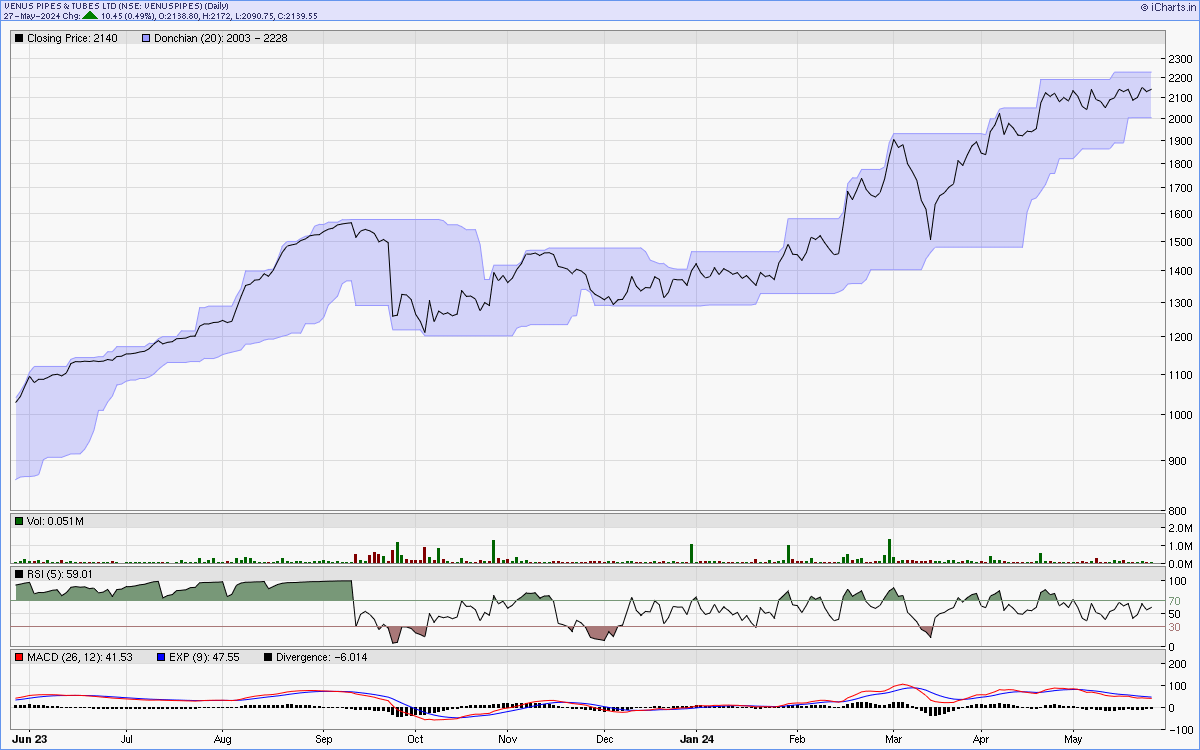
One year line chart
Two years weekly chart
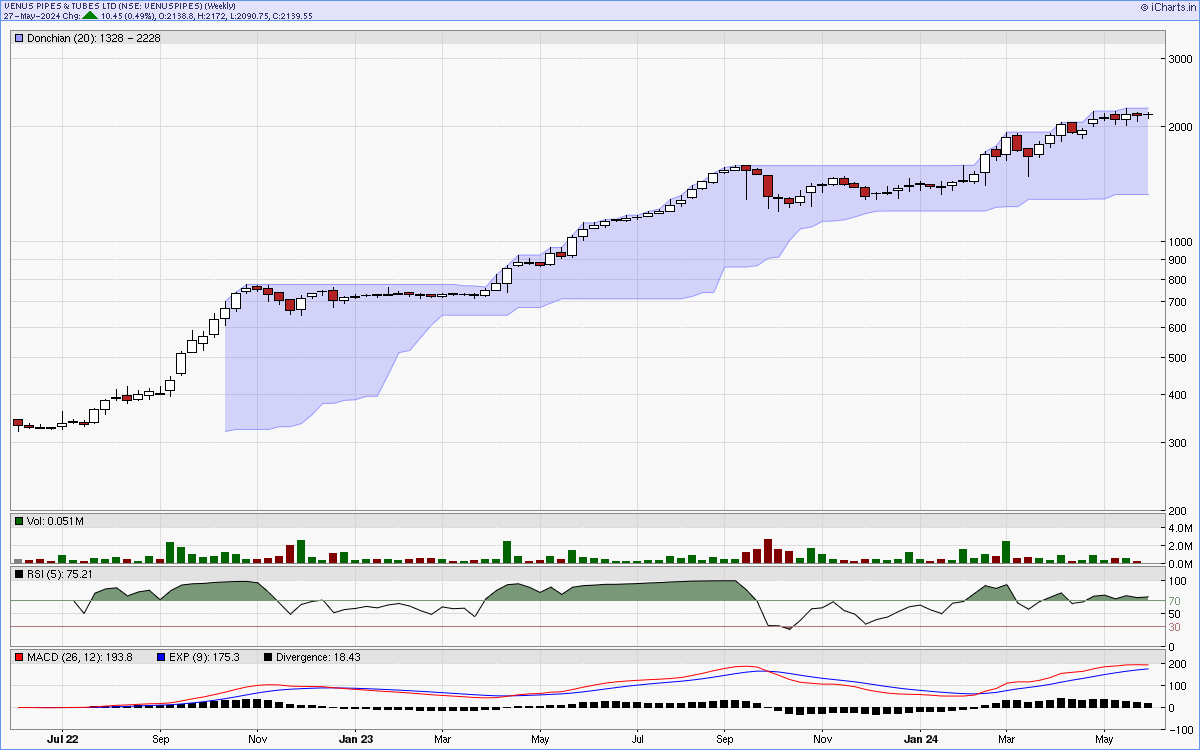
Charts courtsey: iCharts.in