Price / Percentage change:
| Open | High | Low | Close |
| Latest | 4420.00 | 4565.00 | 4406.10 | 4516.70 |
| Prev day | 4529.00 | 4554.65 | 4300.00 | 4391.50 |
| Last week | 3680.00 | 4454.00 | 3651.40 | 4301.75 |
| Last month | 3336.90 | 5084.10 | 3237.80 | 4541.35 |
| All time | | 5084.10 | 30.50 | |
| 1 Day | 5 Day | 20 Day | 50 Day |
| 2.50% | 3.00% | 31.00% | 25.00% |
Trading range:
| TradingRange | Highest
Close | Lowest
Close | Highest
High | Lowest
Low |
| 5 days | 4541.35 | 4301.75 | 5084.10 | 4278.80 |
| 10 days | 4541.35 | 3593.00 | 5084.10 | 3520.00 |
| 20 days | 4541.35 | 3322.95 | 5084.10 | 3237.80 |
Trend analysis :
| Trend | First Signal | Price | Reversal | P SAR |
| BBB | 22-04-2024 | 3718.80 | 3237.80 | 4054.70 |
| ATR (20d) | Williams R | RSI (5d) | RSI (14d) | Vol | Av Vol (20d) |
| 187.27 | 69 | 76 | 76 | 19000 | 50000
|
Fibonacci price projections:
| 0% | 61.8% | 100% | 161.8% | 261.8% |
| Up | 3237.80 | 4378.81 | 5084.10 | 6225.11 | 8071.41 |
| Dn | 5084.10 | 3943.09 | 3237.80 | 2096.79 | 250.49 |
Intraday pivot levels:
| Sup 2 | Sup 1 | Pivot | Res 1 | Res 2 |
| 4337.00 | 4426.75 | 4495.90 | 4585.65 | 4654.75 |
Weekly pivot levels:
| Sup 2 | Sup 1 | Pivot | Res 1 | Res 2 |
| 3333.10 | 3817.40 | 4135.70 | 4620.00 | 4938.25 |
Monthly pivot levels:
| Sup 2 | Sup 1 | Pivot | Res 1 | Res 2 |
| 2441.45 | 3491.40 | 4287.75 | 5337.70 | 6134.05 |
Moving averages (simple):
| 5 Day | 20 Day | 50 Day | 200 Day |
| 4421 | 3798 | 3519 |
3427 |
Other levels:
| 52 Week Hi - Lo | Last Mnth Hi - Lo | Swing Hi - Lo | B Band Hi - Lo |
| 5084.10 - 1777.00 | 5084.10 - 3237.80 | 5084.10 - 3237.80 | 4667.92 - 2927.10 |
|
Charts...
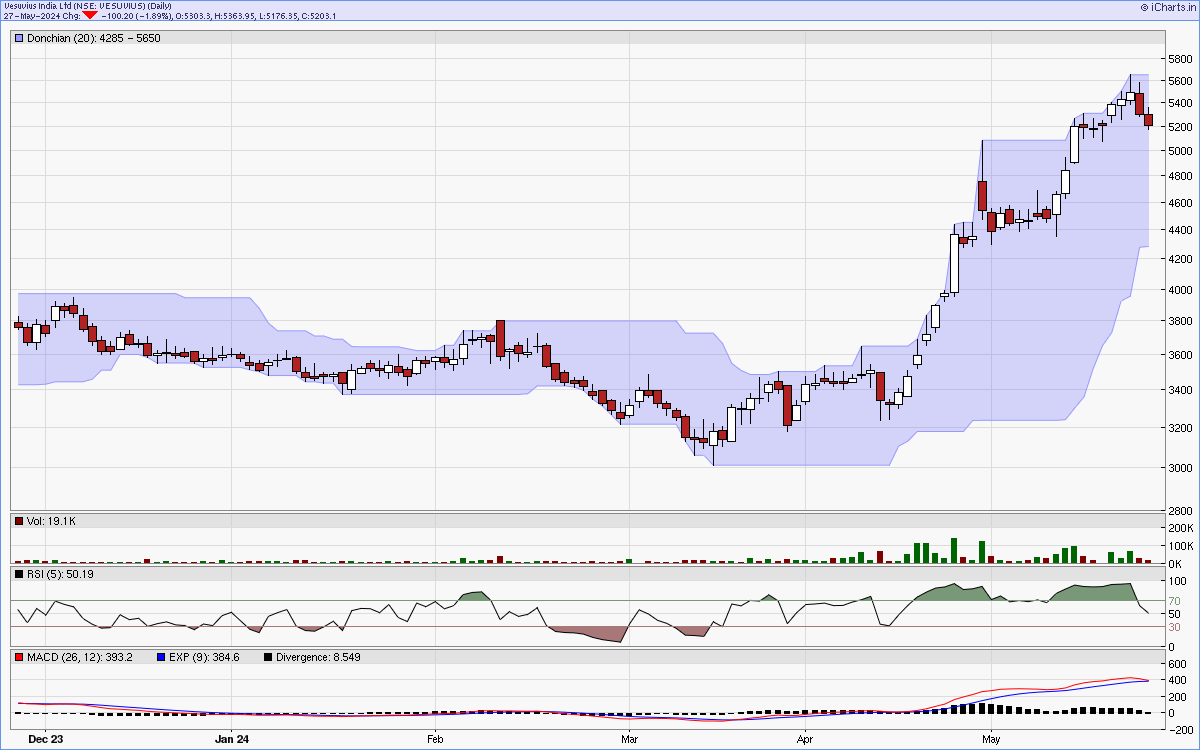
Six months candlestick chart
Charts courtsey: iCharts.in
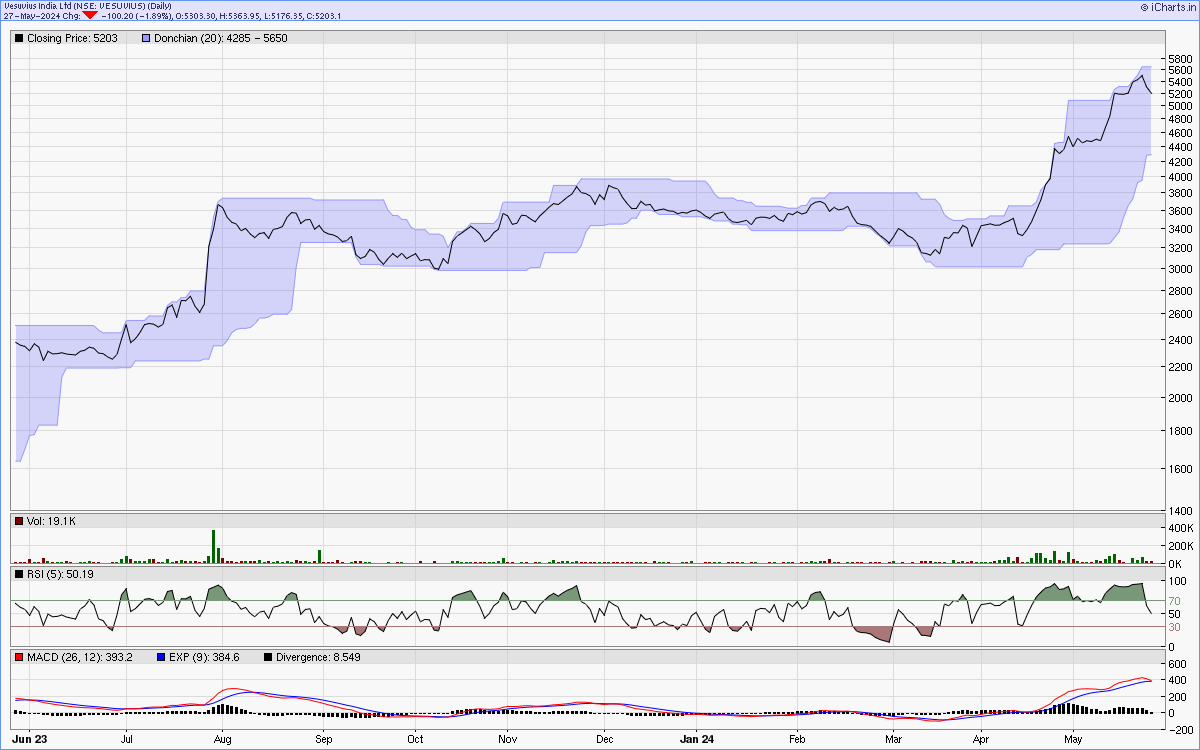
One year line chart
Two years weekly chart
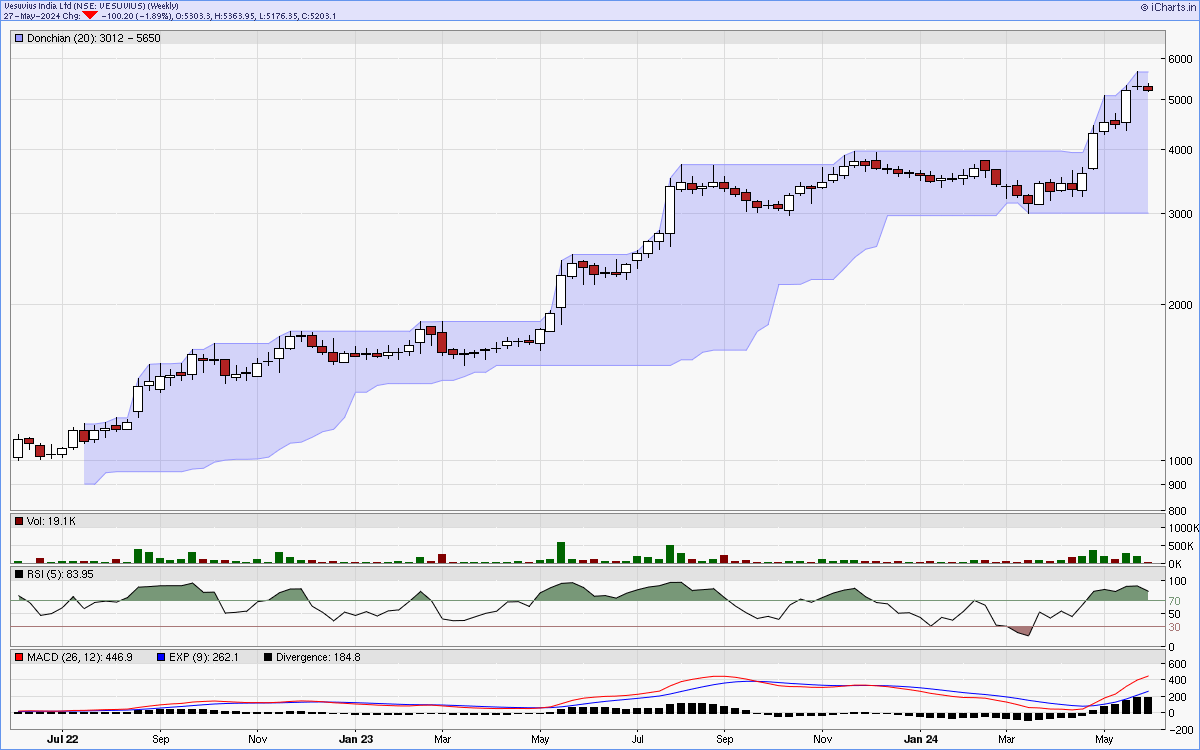
Charts courtsey: iCharts.in