Price / Percentage change:
| Open | High | Low | Close |
| Latest | 950.75 | 968.00 | 915.00 | 941.50 |
| Prev day | 968.00 | 969.80 | 941.00 | 945.05 |
| Last week | 914.90 | 1030.00 | 908.00 | 988.75 |
| Last month | 769.95 | 1030.00 | 765.50 | 966.05 |
| All time | | 1030.00 | 73.00 | |
| 1 Day | 5 Day | 20 Day | 50 Day |
| 0.00% | -5.50% | 19.50% | 30.00% |
Trading range:
| TradingRange | Highest
Close | Lowest
Close | Highest
High | Lowest
Low |
| 5 days | 988.75 | 941.50 | 1012.00 | 915.00 |
| 10 days | 1005.15 | 909.80 | 1030.00 | 903.00 |
| 20 days | 1005.15 | 788.20 | 1030.00 | 765.50 |
Trend analysis :
| Trend | First Signal | Price | Reversal | P SAR |
| BBB | 17-10-2023 | 505.15 | 765.50 | 911.88 |
| ATR (20d) | Williams R | RSI (5d) | RSI (14d) | Vol | Av Vol (20d) |
| 44.21 | 67 | 45 | 60 | 674000 | 940000
|
Fibonacci price projections:
| 0% | 61.8% | 100% | 161.8% | 261.8% |
| Up | 942.00 | 996.38 | 1030.00 | 1084.38 | 1172.38 |
| Dn | 1030.00 | 975.62 | 942.00 | 887.62 | 799.62 |
Intraday pivot levels:
| Sup 2 | Sup 1 | Pivot | Res 1 | Res 2 |
| 888.50 | 915.00 | 941.50 | 968.00 | 994.50 |
Weekly pivot levels:
| Sup 2 | Sup 1 | Pivot | Res 1 | Res 2 |
| 853.55 | 921.10 | 975.55 | 1043.10 | 1097.55 |
Monthly pivot levels:
| Sup 2 | Sup 1 | Pivot | Res 1 | Res 2 |
| 656.00 | 811.00 | 920.50 | 1075.50 | 1185.00 |
Moving averages (simple):
| 5 Day | 20 Day | 50 Day | 200 Day |
| 964 | 896 | 798 |
613 |
Other levels:
| 52 Week Hi - Lo | Last Mnth Hi - Lo | Swing Hi - Lo | B Band Hi - Lo |
| 1030.00 - 389.00 | 1030.00 - 765.50 | 1030.00 - 942.00 | 1059.60 - 732.64 |
|
Charts...
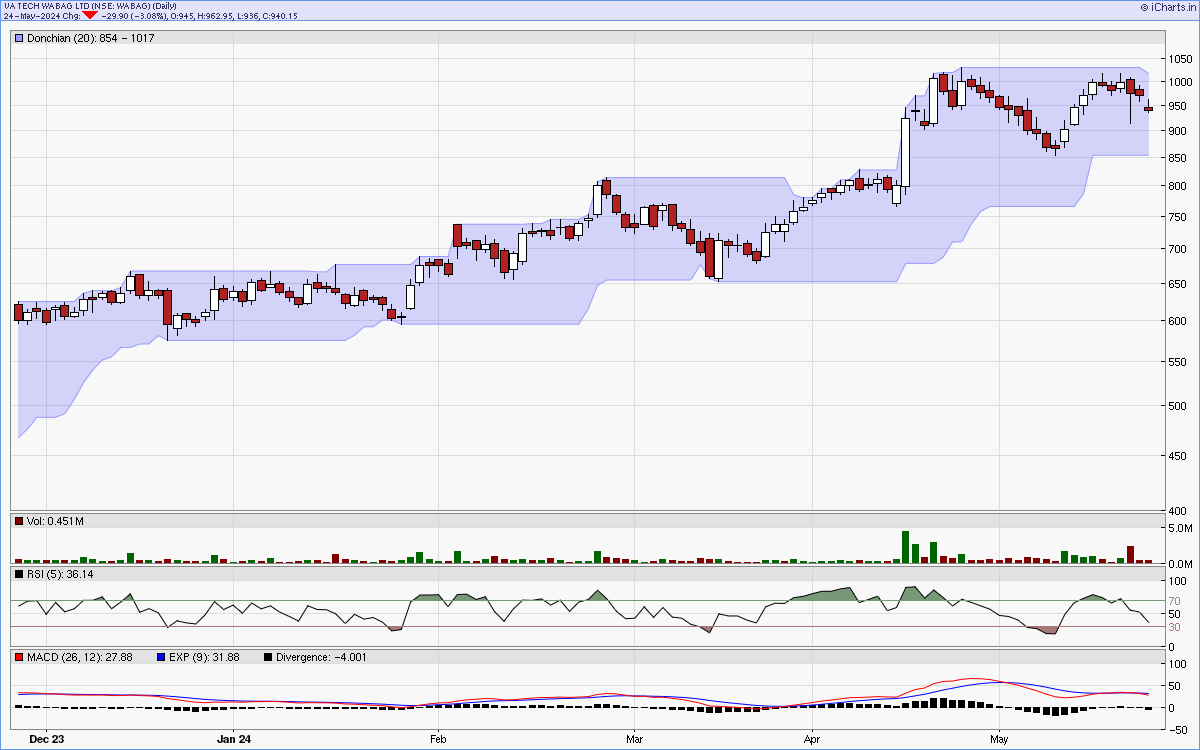
Six months candlestick chart
Charts courtsey: iCharts.in
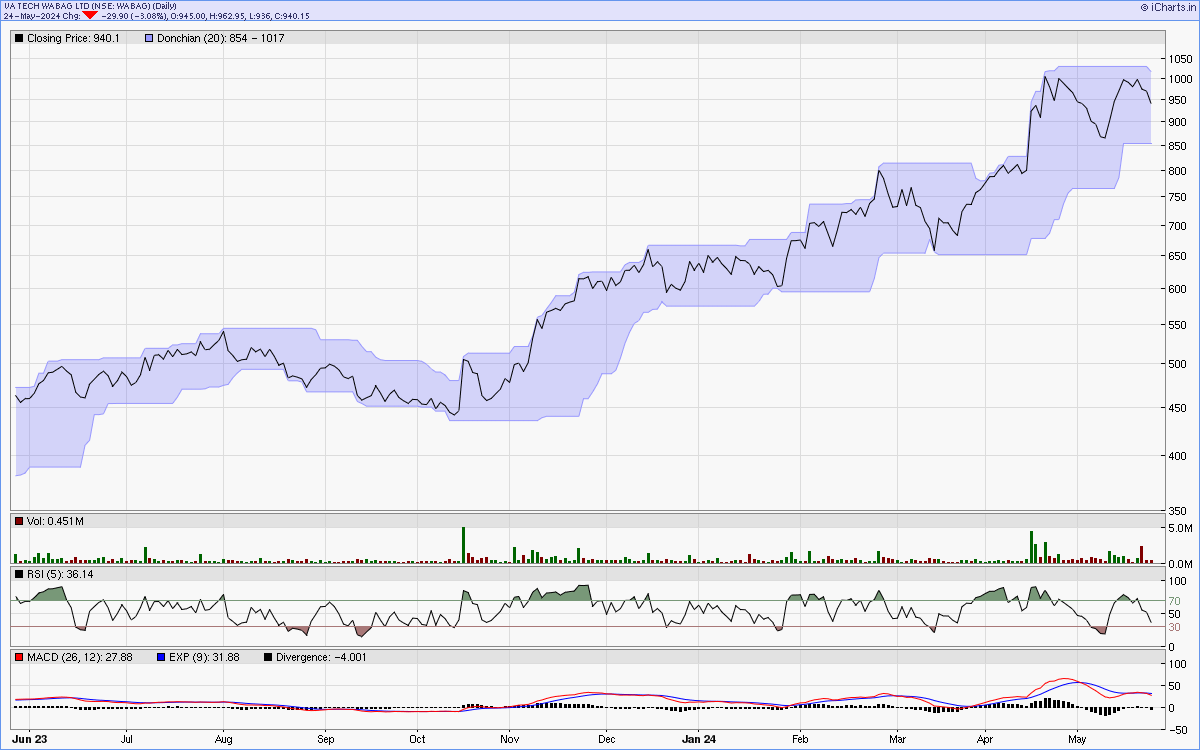
One year line chart
Two years weekly chart
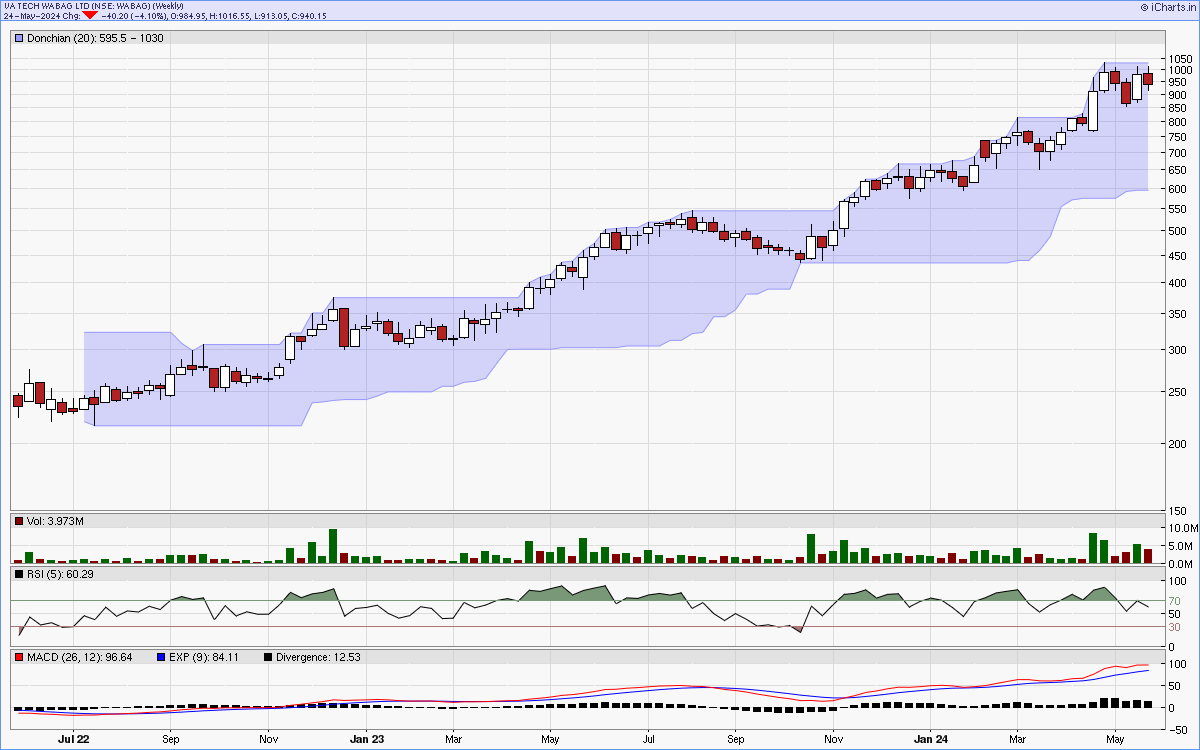
Charts courtsey: iCharts.in