Price / Percentage change:
| Open | High | Low | Close |
| Latest | 1490.10 | 1503.00 | 1460.05 | 1467.30 |
| Prev day | 1504.80 | 1510.95 | 1483.00 | 1490.10 |
| Last week | 1468.00 | 1606.00 | 1455.00 | 1501.10 |
| Last month | 1221.45 | 1606.00 | 1221.45 | 1506.75 |
| All time | | 2787.00 | 127.00 | |
| 1 Day | 5 Day | 20 Day | 50 Day |
| -1.50% | -3.00% | 14.50% | 10.00% |
Trading range:
| TradingRange | Highest
Close | Lowest
Close | Highest
High | Lowest
Low |
| 5 days | 1506.75 | 1467.30 | 1550.00 | 1460.05 |
| 10 days | 1568.50 | 1441.85 | 1606.00 | 1388.10 |
| 20 days | 1568.50 | 1337.65 | 1606.00 | 1276.85 |
Trend analysis :
| Trend | First Signal | Price | Reversal | P SAR |
| BBB | 03-04-2024 | 1343.00 | 1276.85 | 1587.98 |
| ATR (20d) | Williams R | RSI (5d) | RSI (14d) | Vol | Av Vol (20d) |
| 48.07 | 40 | 41 | 58 | 62000 | 228000
|
Fibonacci price projections:
| 0% | 61.8% | 100% | 161.8% | 261.8% |
| Up | 1212.00 | 1455.49 | 1606.00 | 1849.49 | 2243.49 |
| Dn | 1606.00 | 1362.51 | 1212.00 | 968.51 | 574.51 |
Intraday pivot levels:
| Sup 2 | Sup 1 | Pivot | Res 1 | Res 2 |
| 1433.80 | 1450.50 | 1476.75 | 1493.45 | 1519.70 |
Weekly pivot levels:
| Sup 2 | Sup 1 | Pivot | Res 1 | Res 2 |
| 1369.70 | 1435.40 | 1520.70 | 1586.40 | 1671.70 |
Monthly pivot levels:
| Sup 2 | Sup 1 | Pivot | Res 1 | Res 2 |
| 1060.15 | 1283.40 | 1444.70 | 1667.95 | 1829.25 |
Moving averages (simple):
| 5 Day | 20 Day | 50 Day | 200 Day |
| 1488 | 1450 | 1336 |
1461 |
Other levels:
| 52 Week Hi - Lo | Last Mnth Hi - Lo | Swing Hi - Lo | B Band Hi - Lo |
| 1733.00 - 1186.10 | 1606.00 - 1221.45 | 1606.00 - 1212.00 | 1580.33 - 1319.25 |
|
Charts...
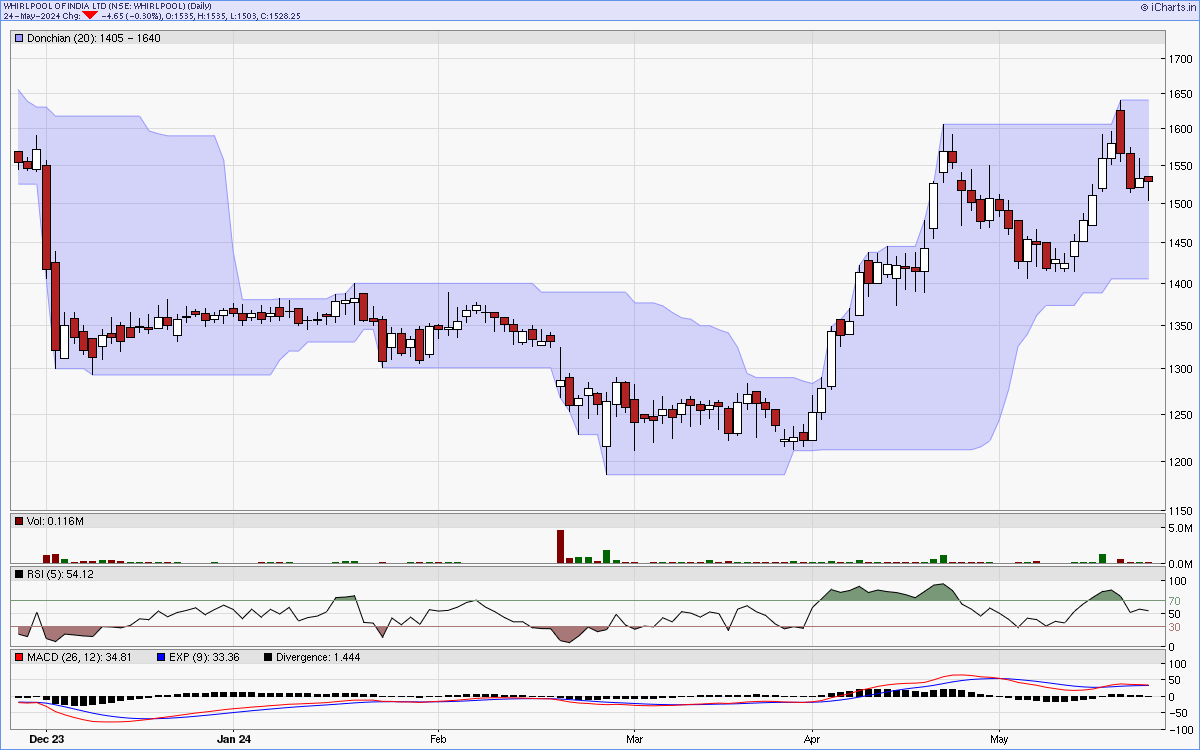
Six months candlestick chart
Charts courtsey: iCharts.in
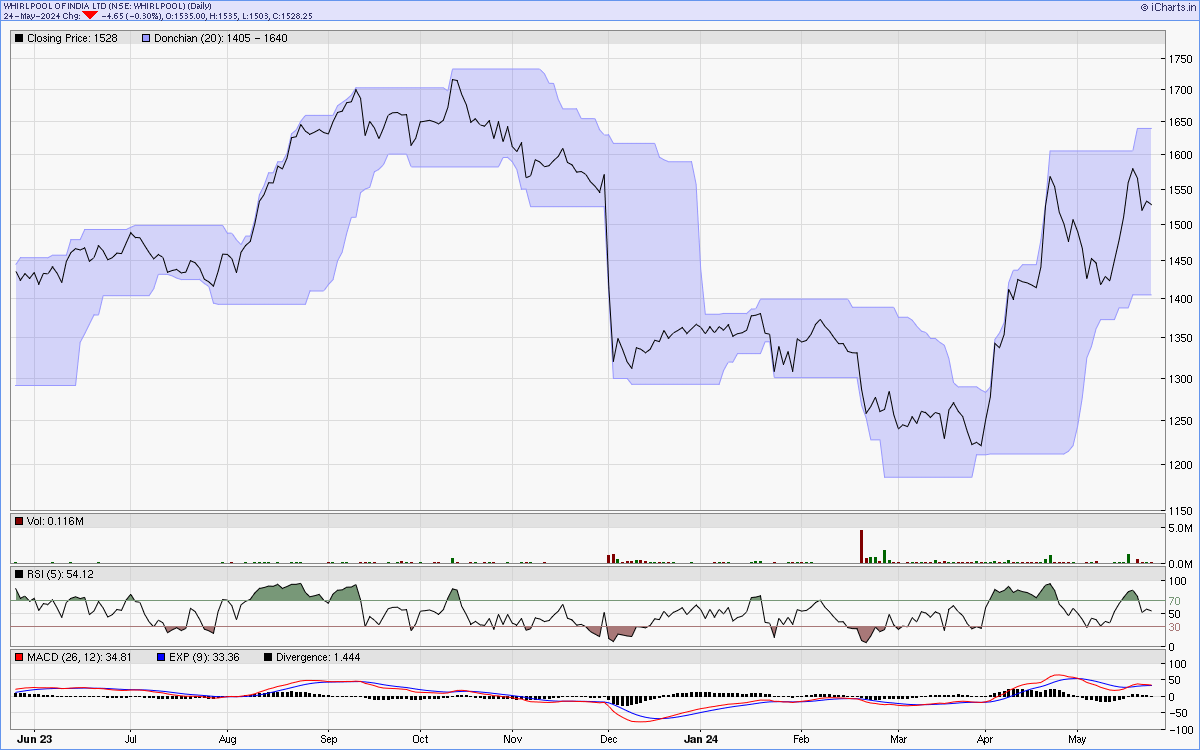
One year line chart
Two years weekly chart
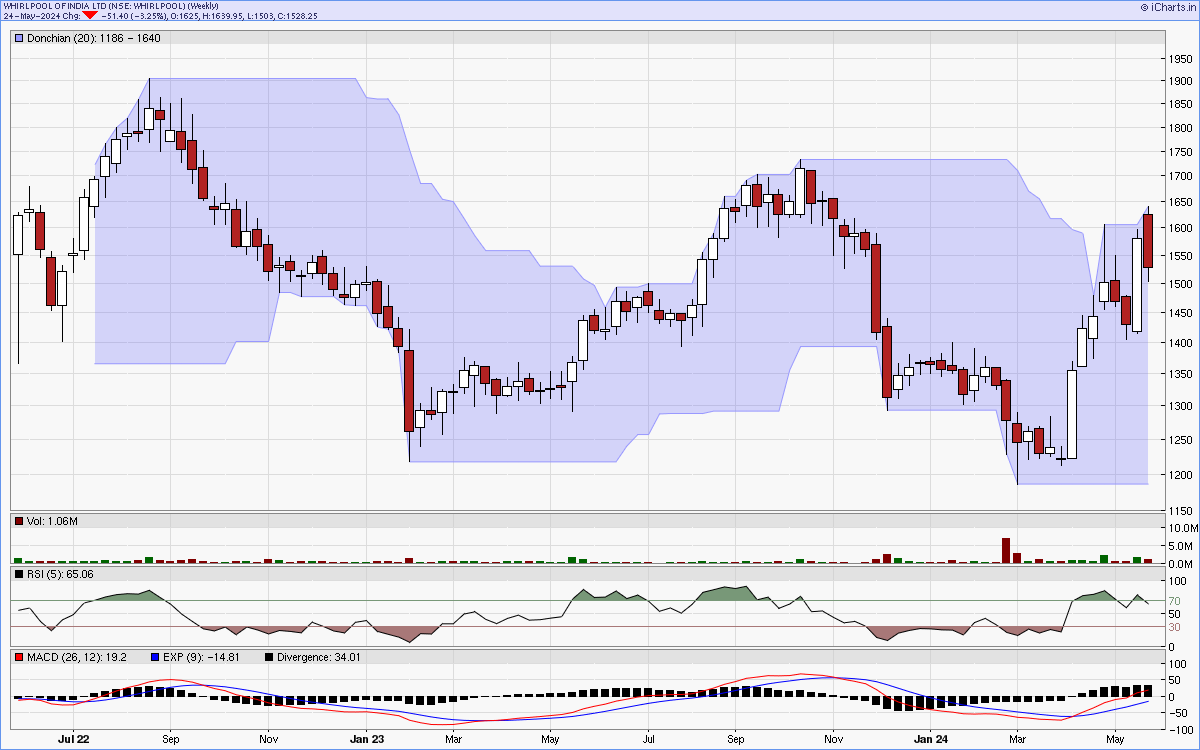
Charts courtsey: iCharts.in