Price / Percentage change:
| Open | High | Low | Close |
| Latest | 959.90 | 992.00 | 951.05 | 988.00 |
| Prev day | 964.90 | 968.40 | 948.95 | 953.55 |
| Last week | 936.15 | 968.05 | 914.50 | 947.40 |
| Last month | 1024.95 | 1031.70 | 913.20 | 953.55 |
| All time | | 1031.70 | 33.00 | |
| 1 Day | 5 Day | 20 Day | 50 Day |
| 3.50% | 5.50% | -1.00% | 13.50% |
Trading range:
| TradingRange | Highest
Close | Lowest
Close | Highest
High | Lowest
Low |
| 5 days | 988.00 | 947.40 | 992.00 | 925.40 |
| 10 days | 988.00 | 922.15 | 992.00 | 913.20 |
| 20 days | 1006.50 | 922.15 | 1013.55 | 913.20 |
Trend analysis :
| Trend | First Signal | Price | Reversal | P SAR |
| SSS | 15-04-2024 | 935.15 | 1013.55 | 913.20 |
| ATR (20d) | Williams R | RSI (5d) | RSI (14d) | Vol | Av Vol (20d) |
| 27.28 | 87 | 69 | 57 | 2761000 | 1419000
|
Fibonacci price projections:
| 0% | 61.8% | 100% | 161.8% | 261.8% |
| Up | 914.50 | 986.93 | 1031.70 | 1104.13 | 1221.33 |
| Dn | 1031.70 | 959.27 | 914.50 | 842.07 | 724.87 |
Intraday pivot levels:
| Sup 2 | Sup 1 | Pivot | Res 1 | Res 2 |
| 936.05 | 962.00 | 977.00 | 1002.95 | 1017.95 |
Weekly pivot levels:
| Sup 2 | Sup 1 | Pivot | Res 1 | Res 2 |
| 889.75 | 918.55 | 943.30 | 972.10 | 996.85 |
Monthly pivot levels:
| Sup 2 | Sup 1 | Pivot | Res 1 | Res 2 |
| 847.65 | 900.60 | 966.15 | 1019.10 | 1084.65 |
Moving averages (simple):
| 5 Day | 20 Day | 50 Day | 200 Day |
| 961 | 966 | 960 |
728 |
Other levels:
| 52 Week Hi - Lo | Last Mnth Hi - Lo | Swing Hi - Lo | B Band Hi - Lo |
| 1031.70 - 484.95 | 1031.70 - 913.20 | 1031.70 - 914.50 | 1014.95 - 916.21 |
|
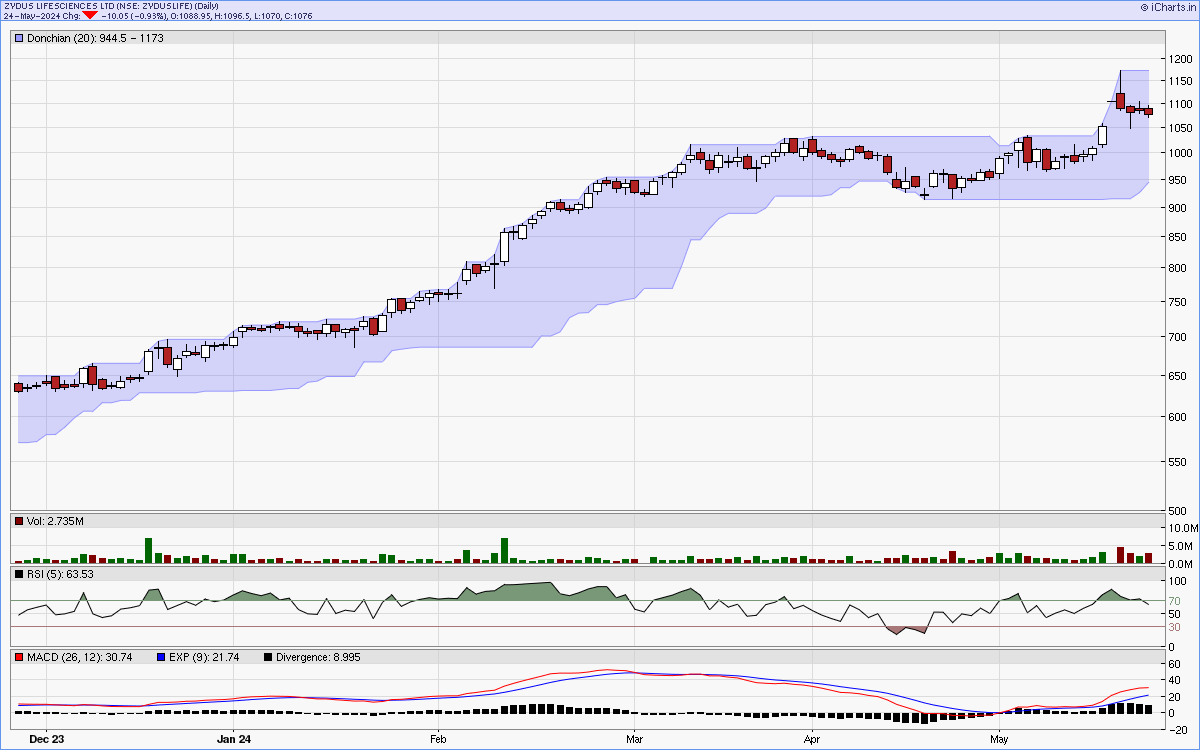
Charts...
Six months candlestick chart
Charts courtsey: iCharts.in
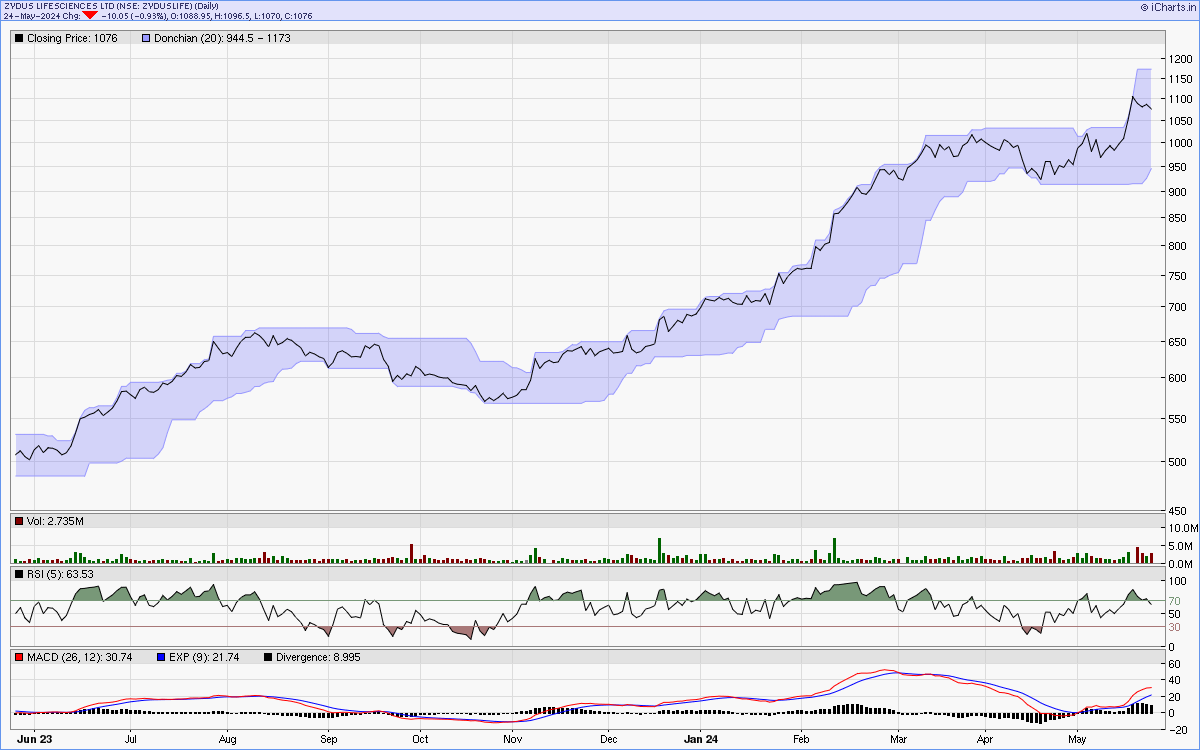
One year line chart
Two years weekly chart
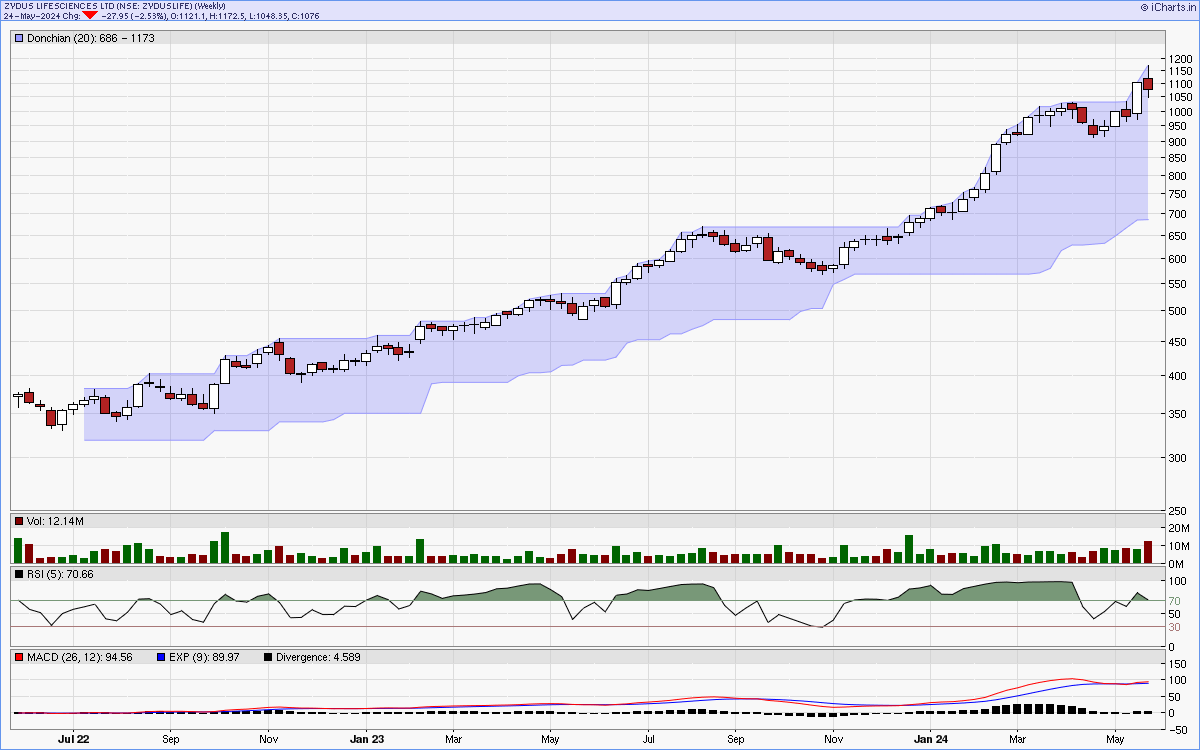
Charts courtsey: iCharts.in