Price / Percentage change:
| Open | High | Low | Close |
| Latest | 1671.05 | 1694.95 | 1661.75 | 1670.50 |
| Prev day | 1666.00 | 1677.00 | 1637.00 | 1671.00 |
| Last week | 1639.95 | 1682.65 | 1620.00 | 1669.45 |
| Last month | 1485.05 | 1682.65 | 1480.00 | 1665.90 |
| All time | | 2476.85 | 327.00 | |
| 1 Day | 5 Day | 20 Day | 50 Day |
| 0.00% | 0.00% | 11.00% | 5.50% |
Trading range:
| TradingRange | Highest
Close | Lowest
Close | Highest
High | Lowest
Low |
| 5 days | 1671.00 | 1645.65 | 1694.95 | 1633.00 |
| 10 days | 1671.40 | 1631.80 | 1694.95 | 1587.85 |
| 20 days | 1671.40 | 1550.45 | 1694.95 | 1500.00 |
Trend analysis :
| Trend | First Signal | Price | Reversal | P SAR |
| BBB | 12-04-2024 | 1610.15 | 1500.00 | 1633.00 |
| ATR (20d) | Williams R | RSI (5d) | RSI (14d) | Vol | Av Vol (20d) |
| 38.47 | 82 | 66 | 65 | 27000 | 32000
|
Fibonacci price projections:
| 0% | 61.8% | 100% | 161.8% | 261.8% |
| Up | 1440.15 | 1579.11 | 1665.00 | 1803.96 | 2028.81 |
| Dn | 1665.00 | 1526.04 | 1440.15 | 1301.19 | 1076.34 |
Intraday pivot levels:
| Sup 2 | Sup 1 | Pivot | Res 1 | Res 2 |
| 1642.50 | 1656.45 | 1675.70 | 1689.65 | 1708.90 |
Weekly pivot levels:
| Sup 2 | Sup 1 | Pivot | Res 1 | Res 2 |
| 1594.65 | 1632.00 | 1657.35 | 1694.70 | 1720.00 |
Monthly pivot levels:
| Sup 2 | Sup 1 | Pivot | Res 1 | Res 2 |
| 1406.85 | 1536.35 | 1609.50 | 1739.00 | 1812.15 |
Moving averages (simple):
| 5 Day | 20 Day | 50 Day | 200 Day |
| 1665 | 1624 | 1575 |
1570 |
Other levels:
| 52 Week Hi - Lo | Last Mnth Hi - Lo | Swing Hi - Lo | B Band Hi - Lo |
| 1721.00 - 1425.05 | 1682.65 - 1480.00 | 1665.00 - 1440.15 | 1703.07 - 1544.83 |
|
Charts...
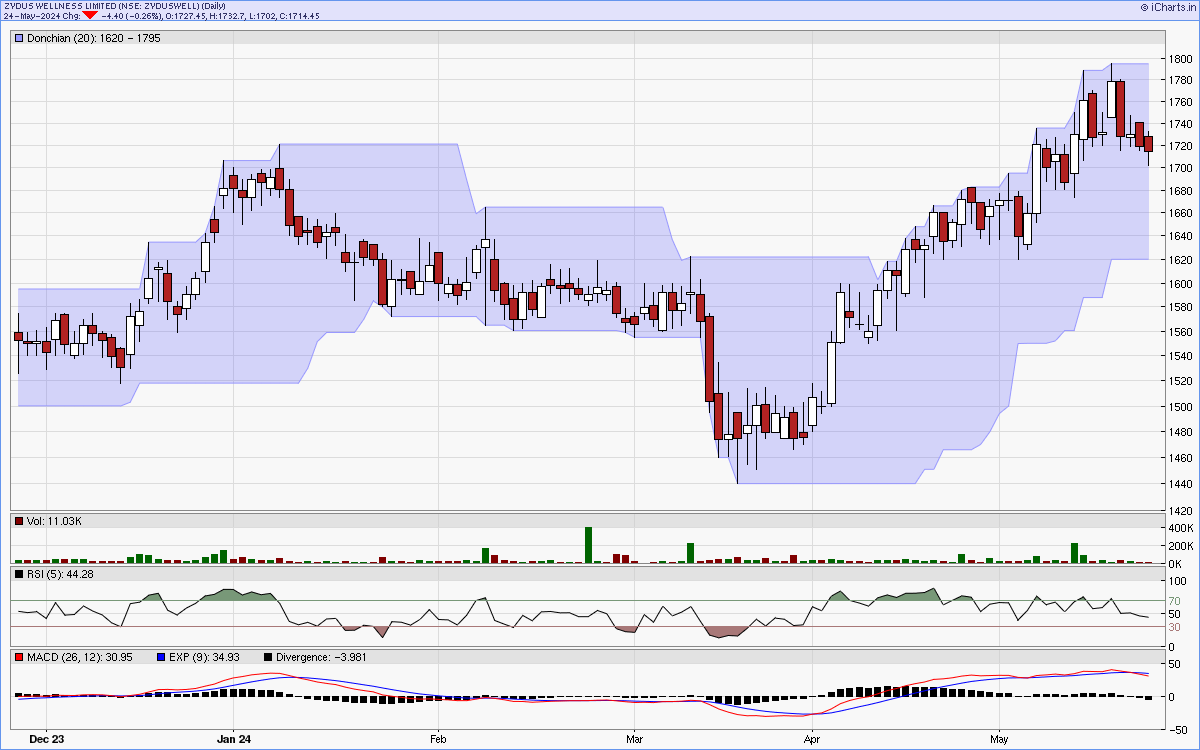
Six months candlestick chart
Charts courtsey: iCharts.in
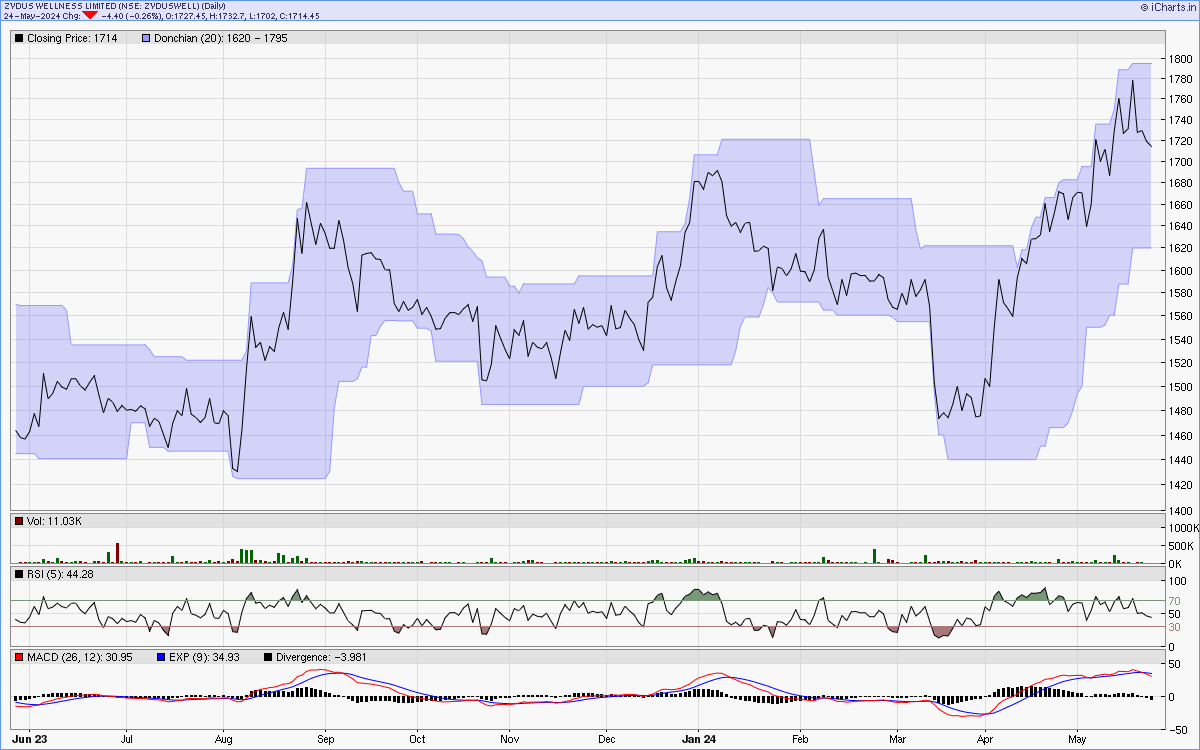
One year line chart
Two years weekly chart
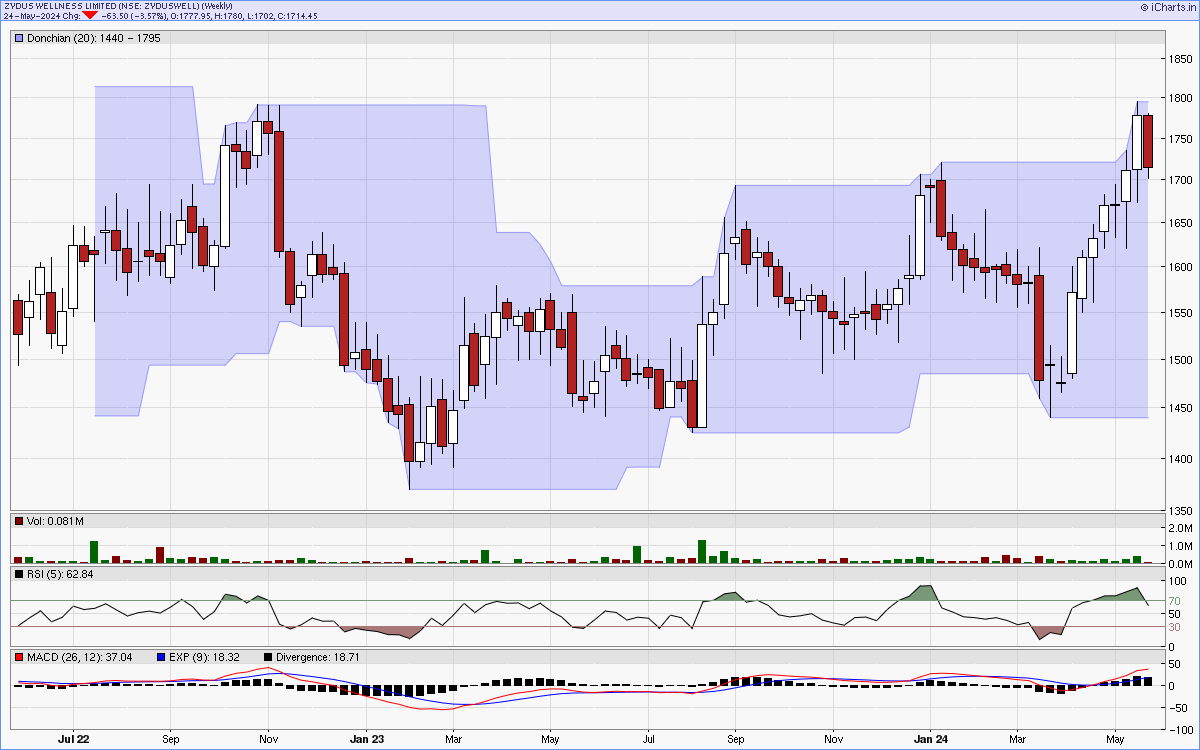
Charts courtsey: iCharts.in